Tables
Tables bring structured data into ainative-business — a built-in spreadsheet-meets-database where you can organize business metrics, track operational data, and build lightweight data workflows without leaving the workspace. Create tables from scratch, import from files, clone from templates, or let an agent build one from a plain-language description.
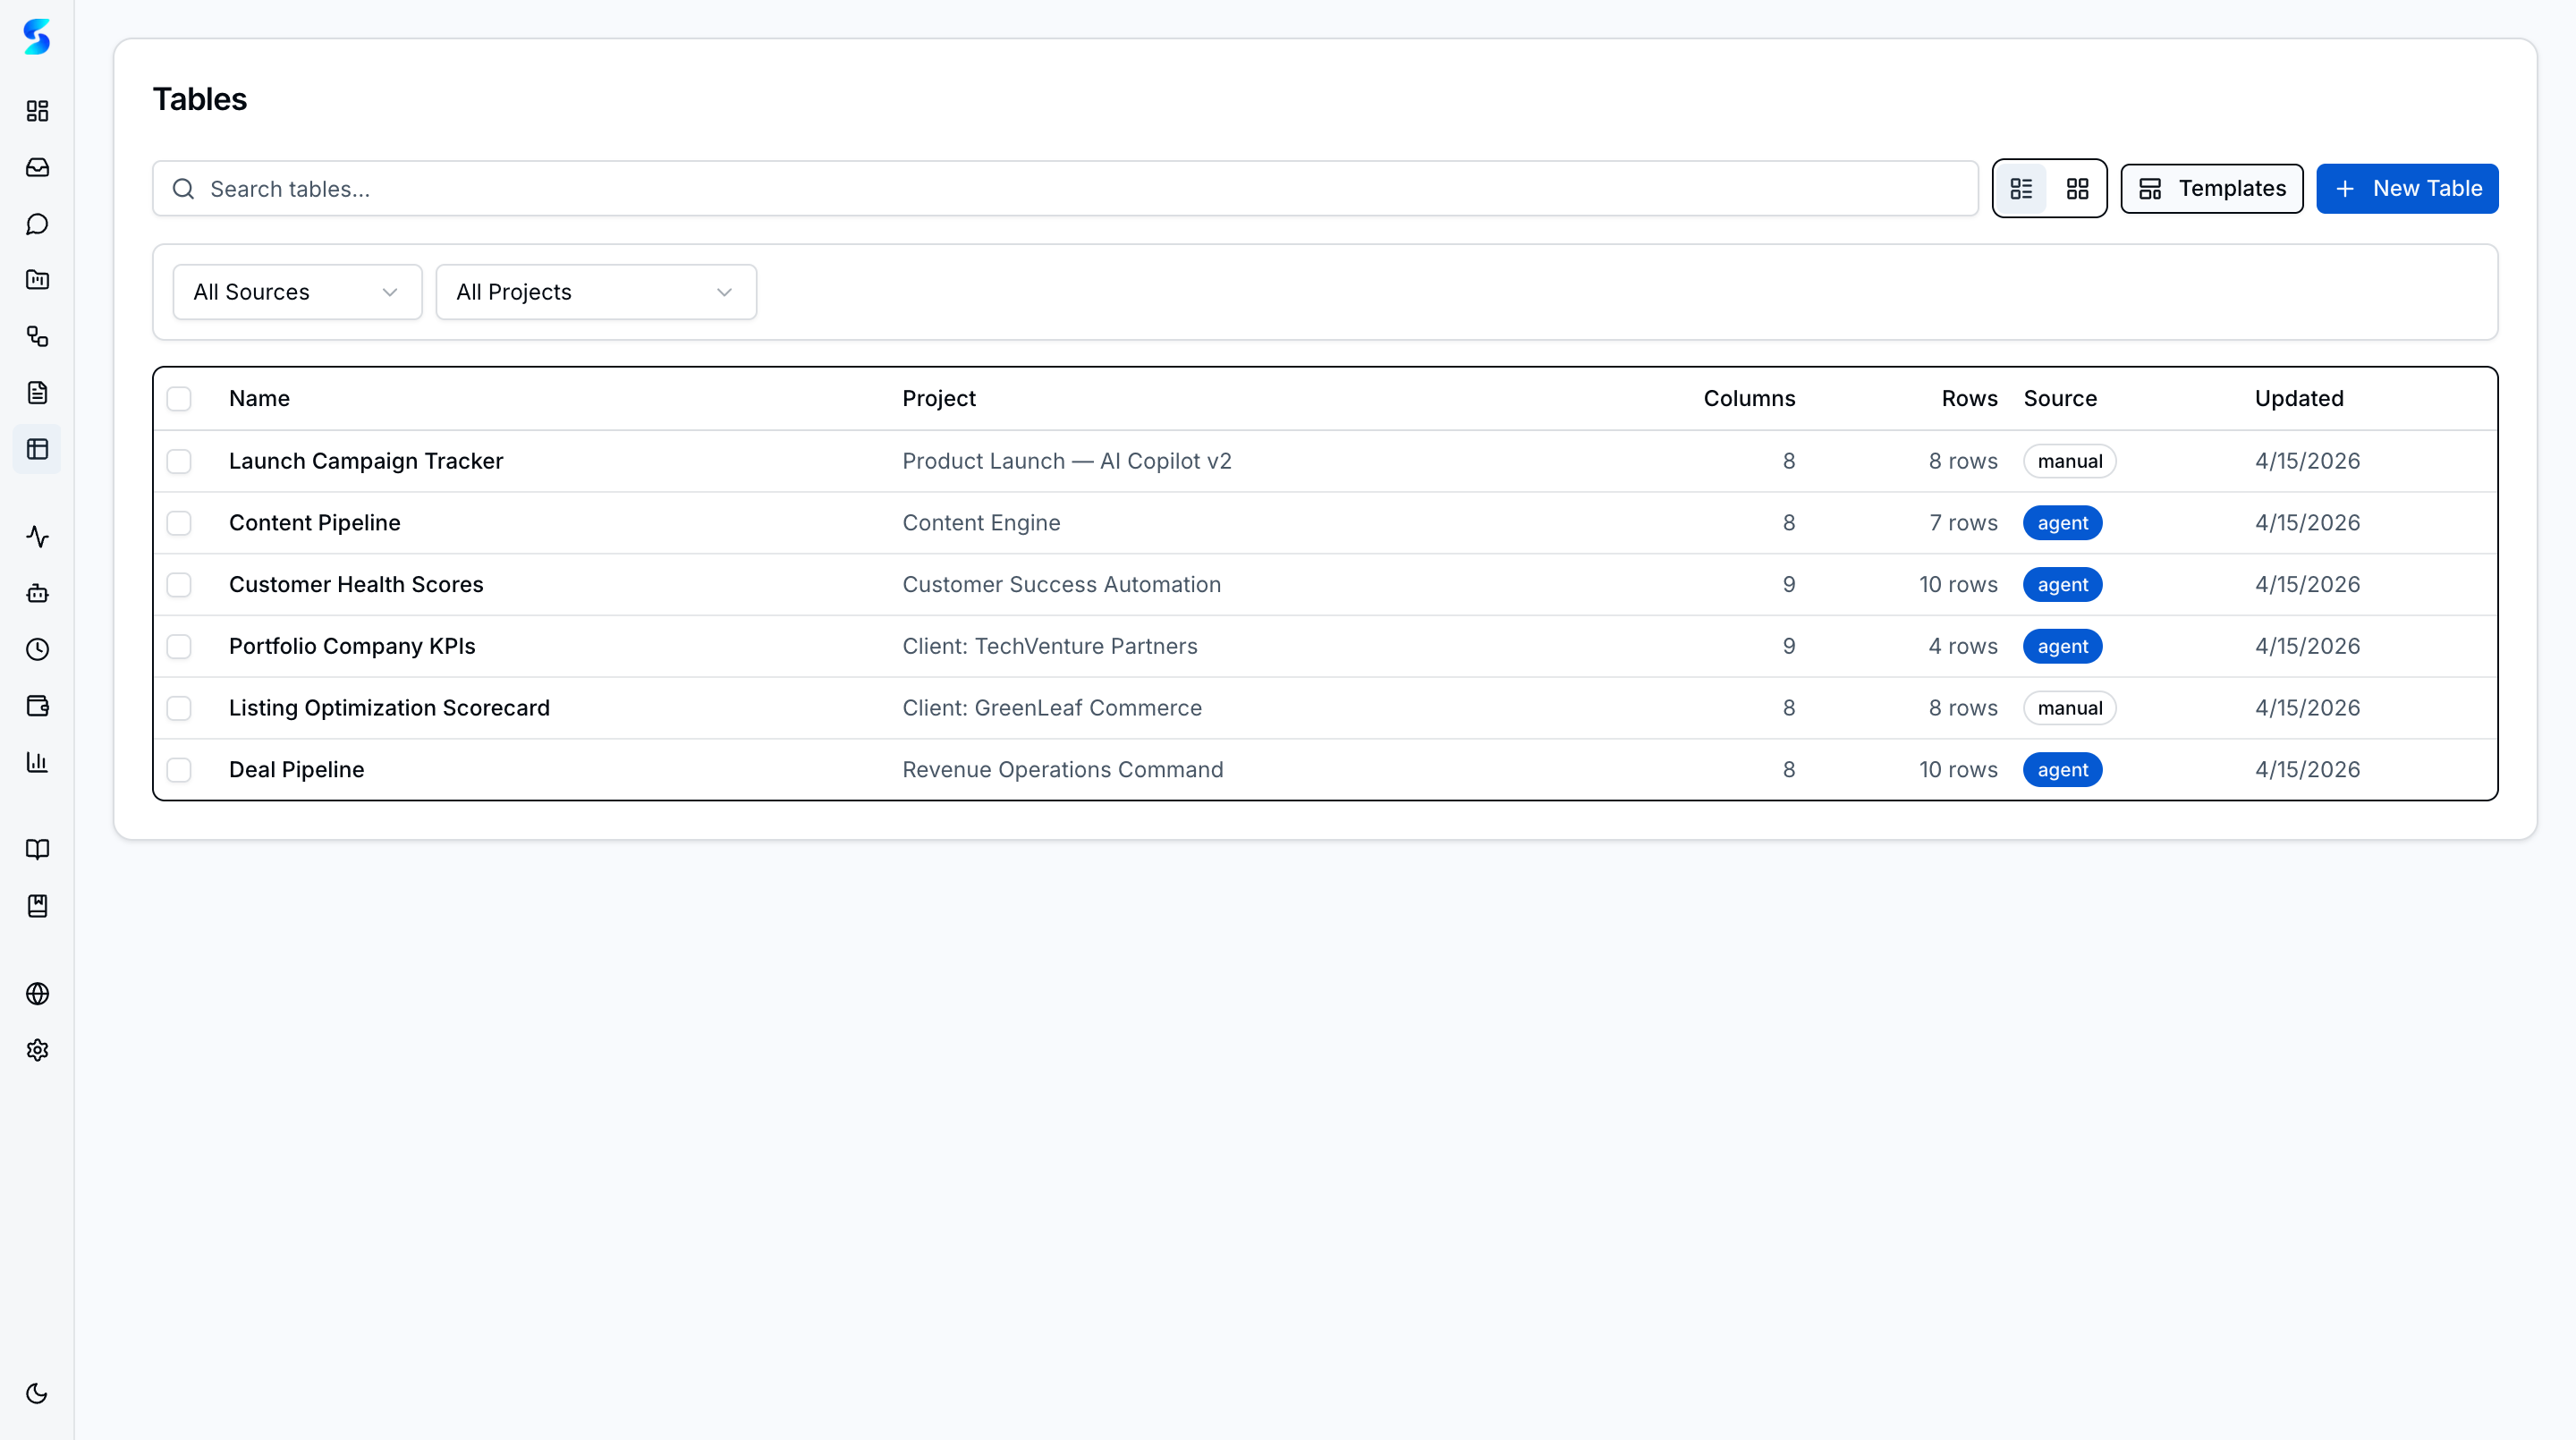
Tables is ainative-business’s structured data system — a built-in spreadsheet-meets-database that lets you organize business data, track metrics, and build lightweight operational workflows without leaving the platform. Create tables from scratch, import from files, or let an agent build one from a plain-language description. Each table supports inline editing, computed columns, charts, automated triggers, and full agent access so your AI assistants can query, update, and act on your data.
Screenshots
Tables list view with search, filters, and table/grid toggle
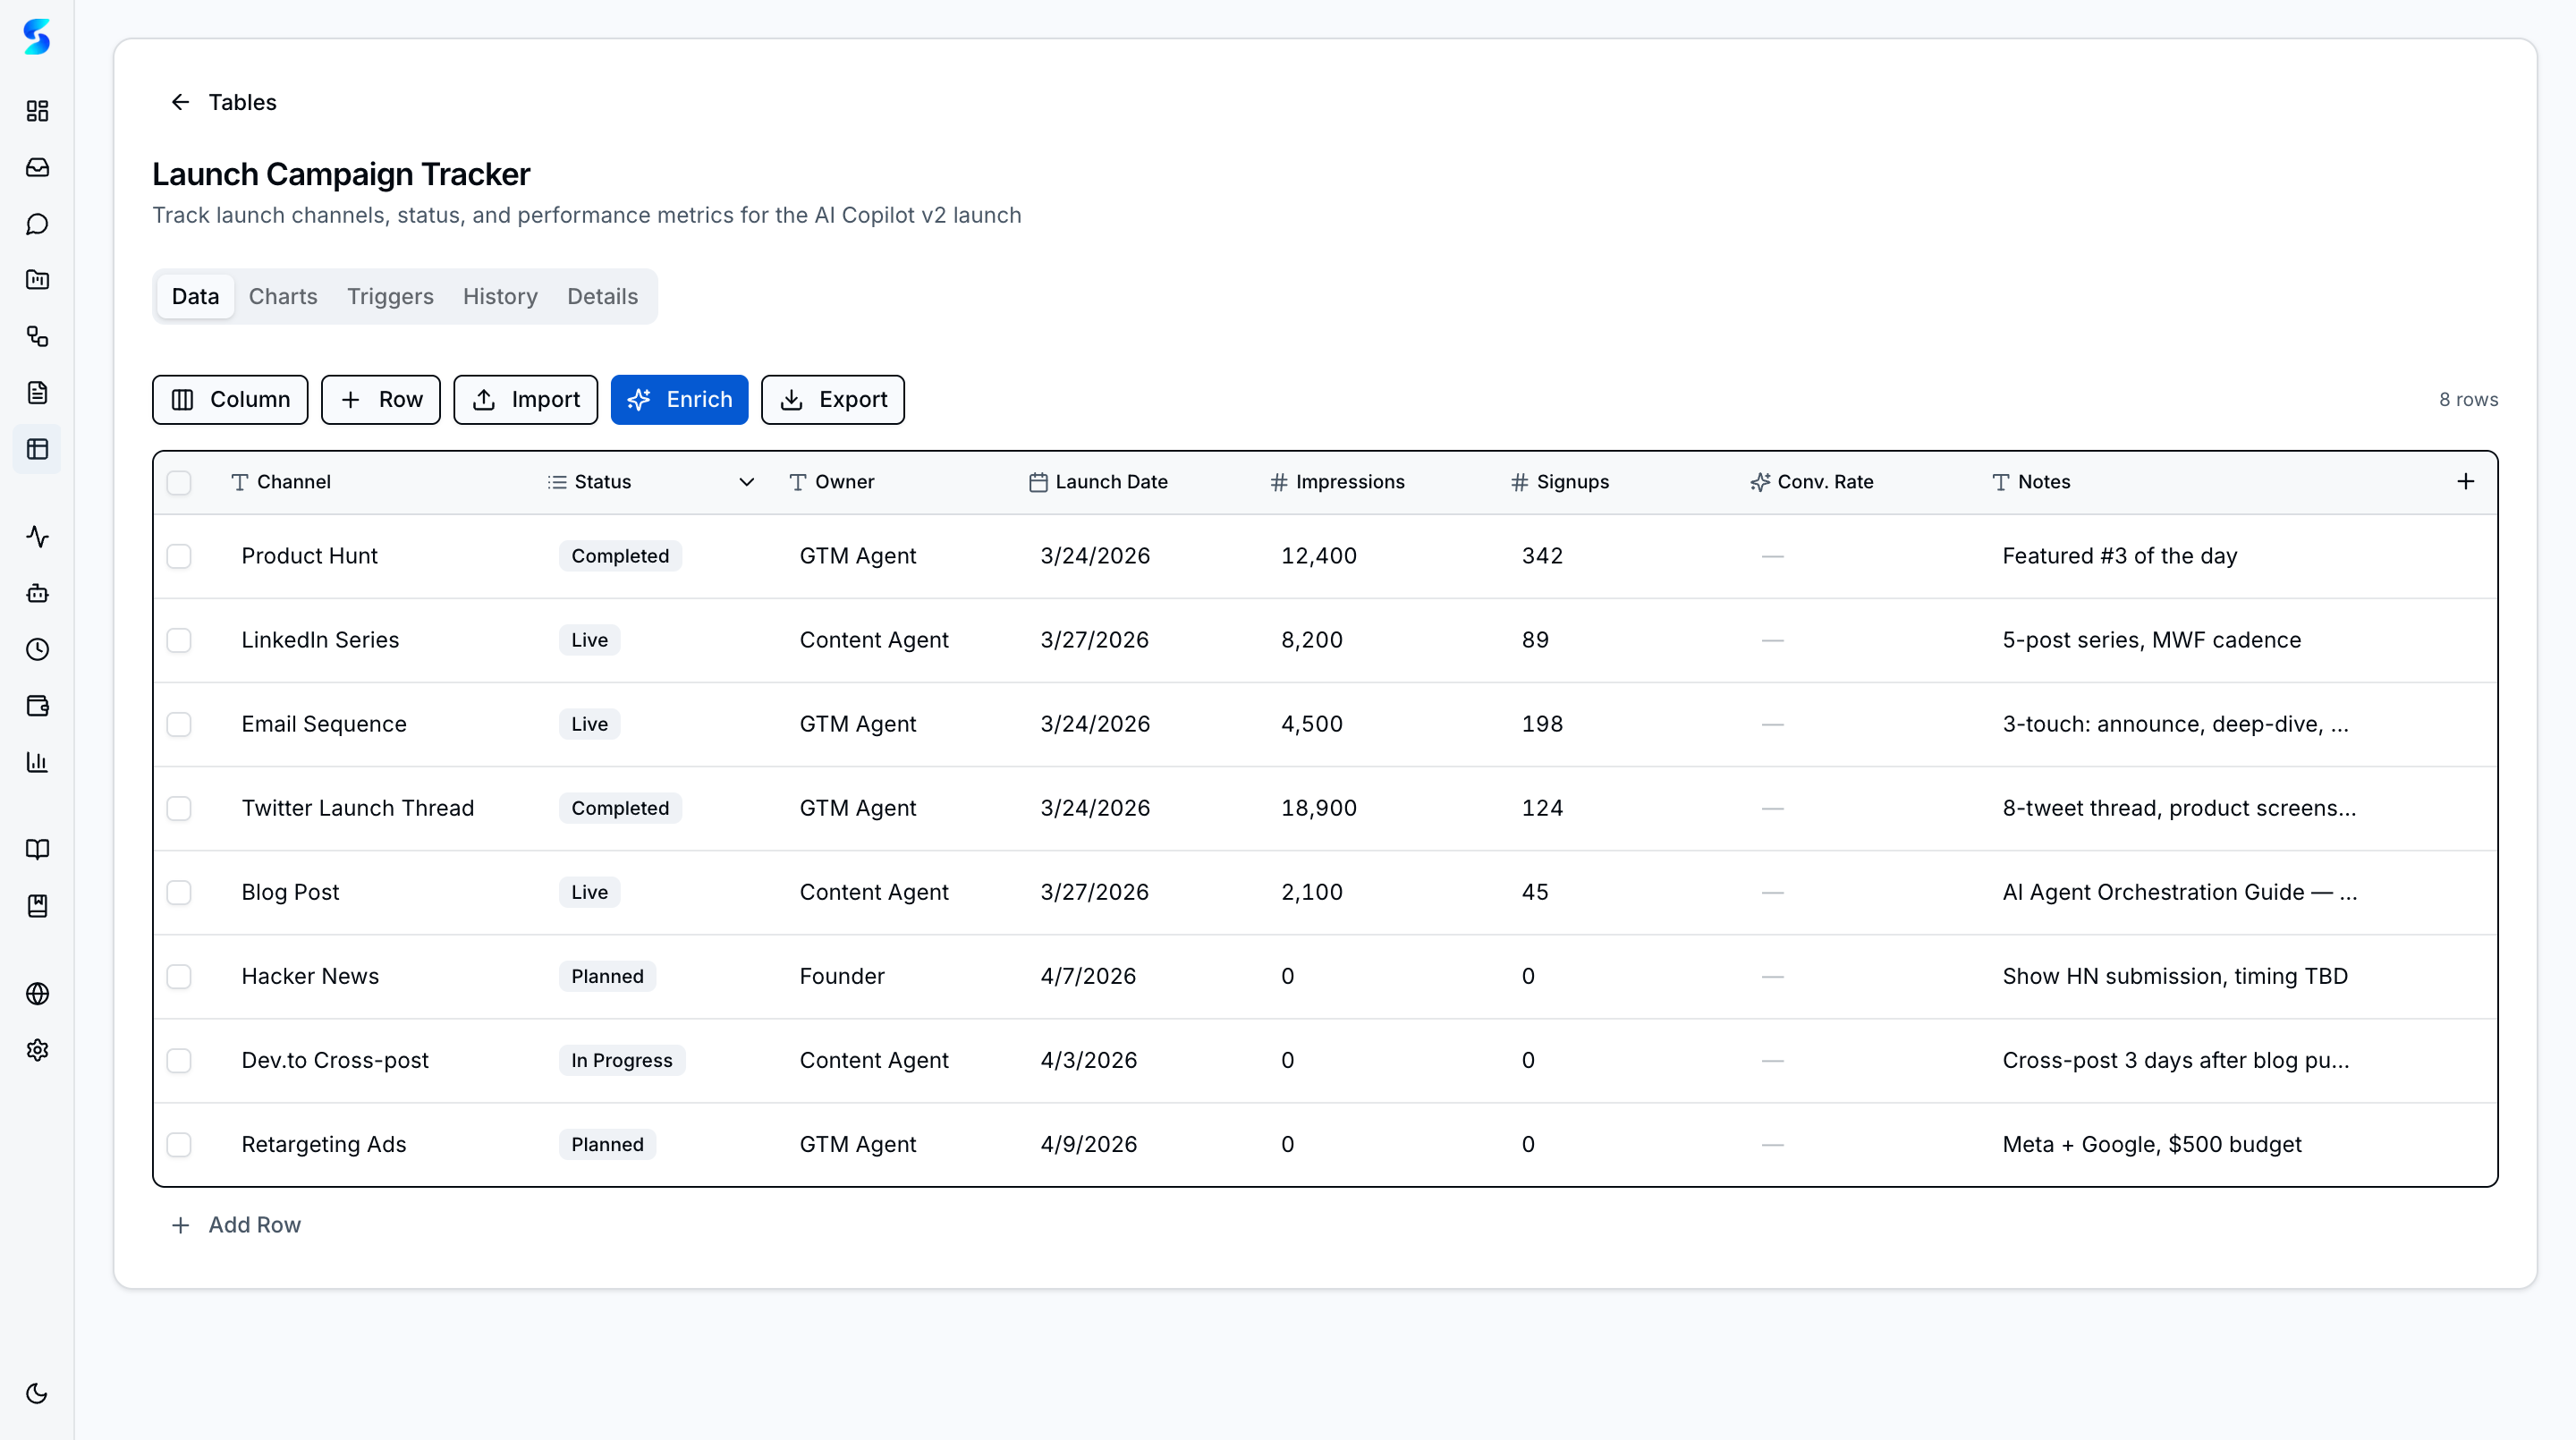 Spreadsheet editor with inline cell editing and keyboard navigation
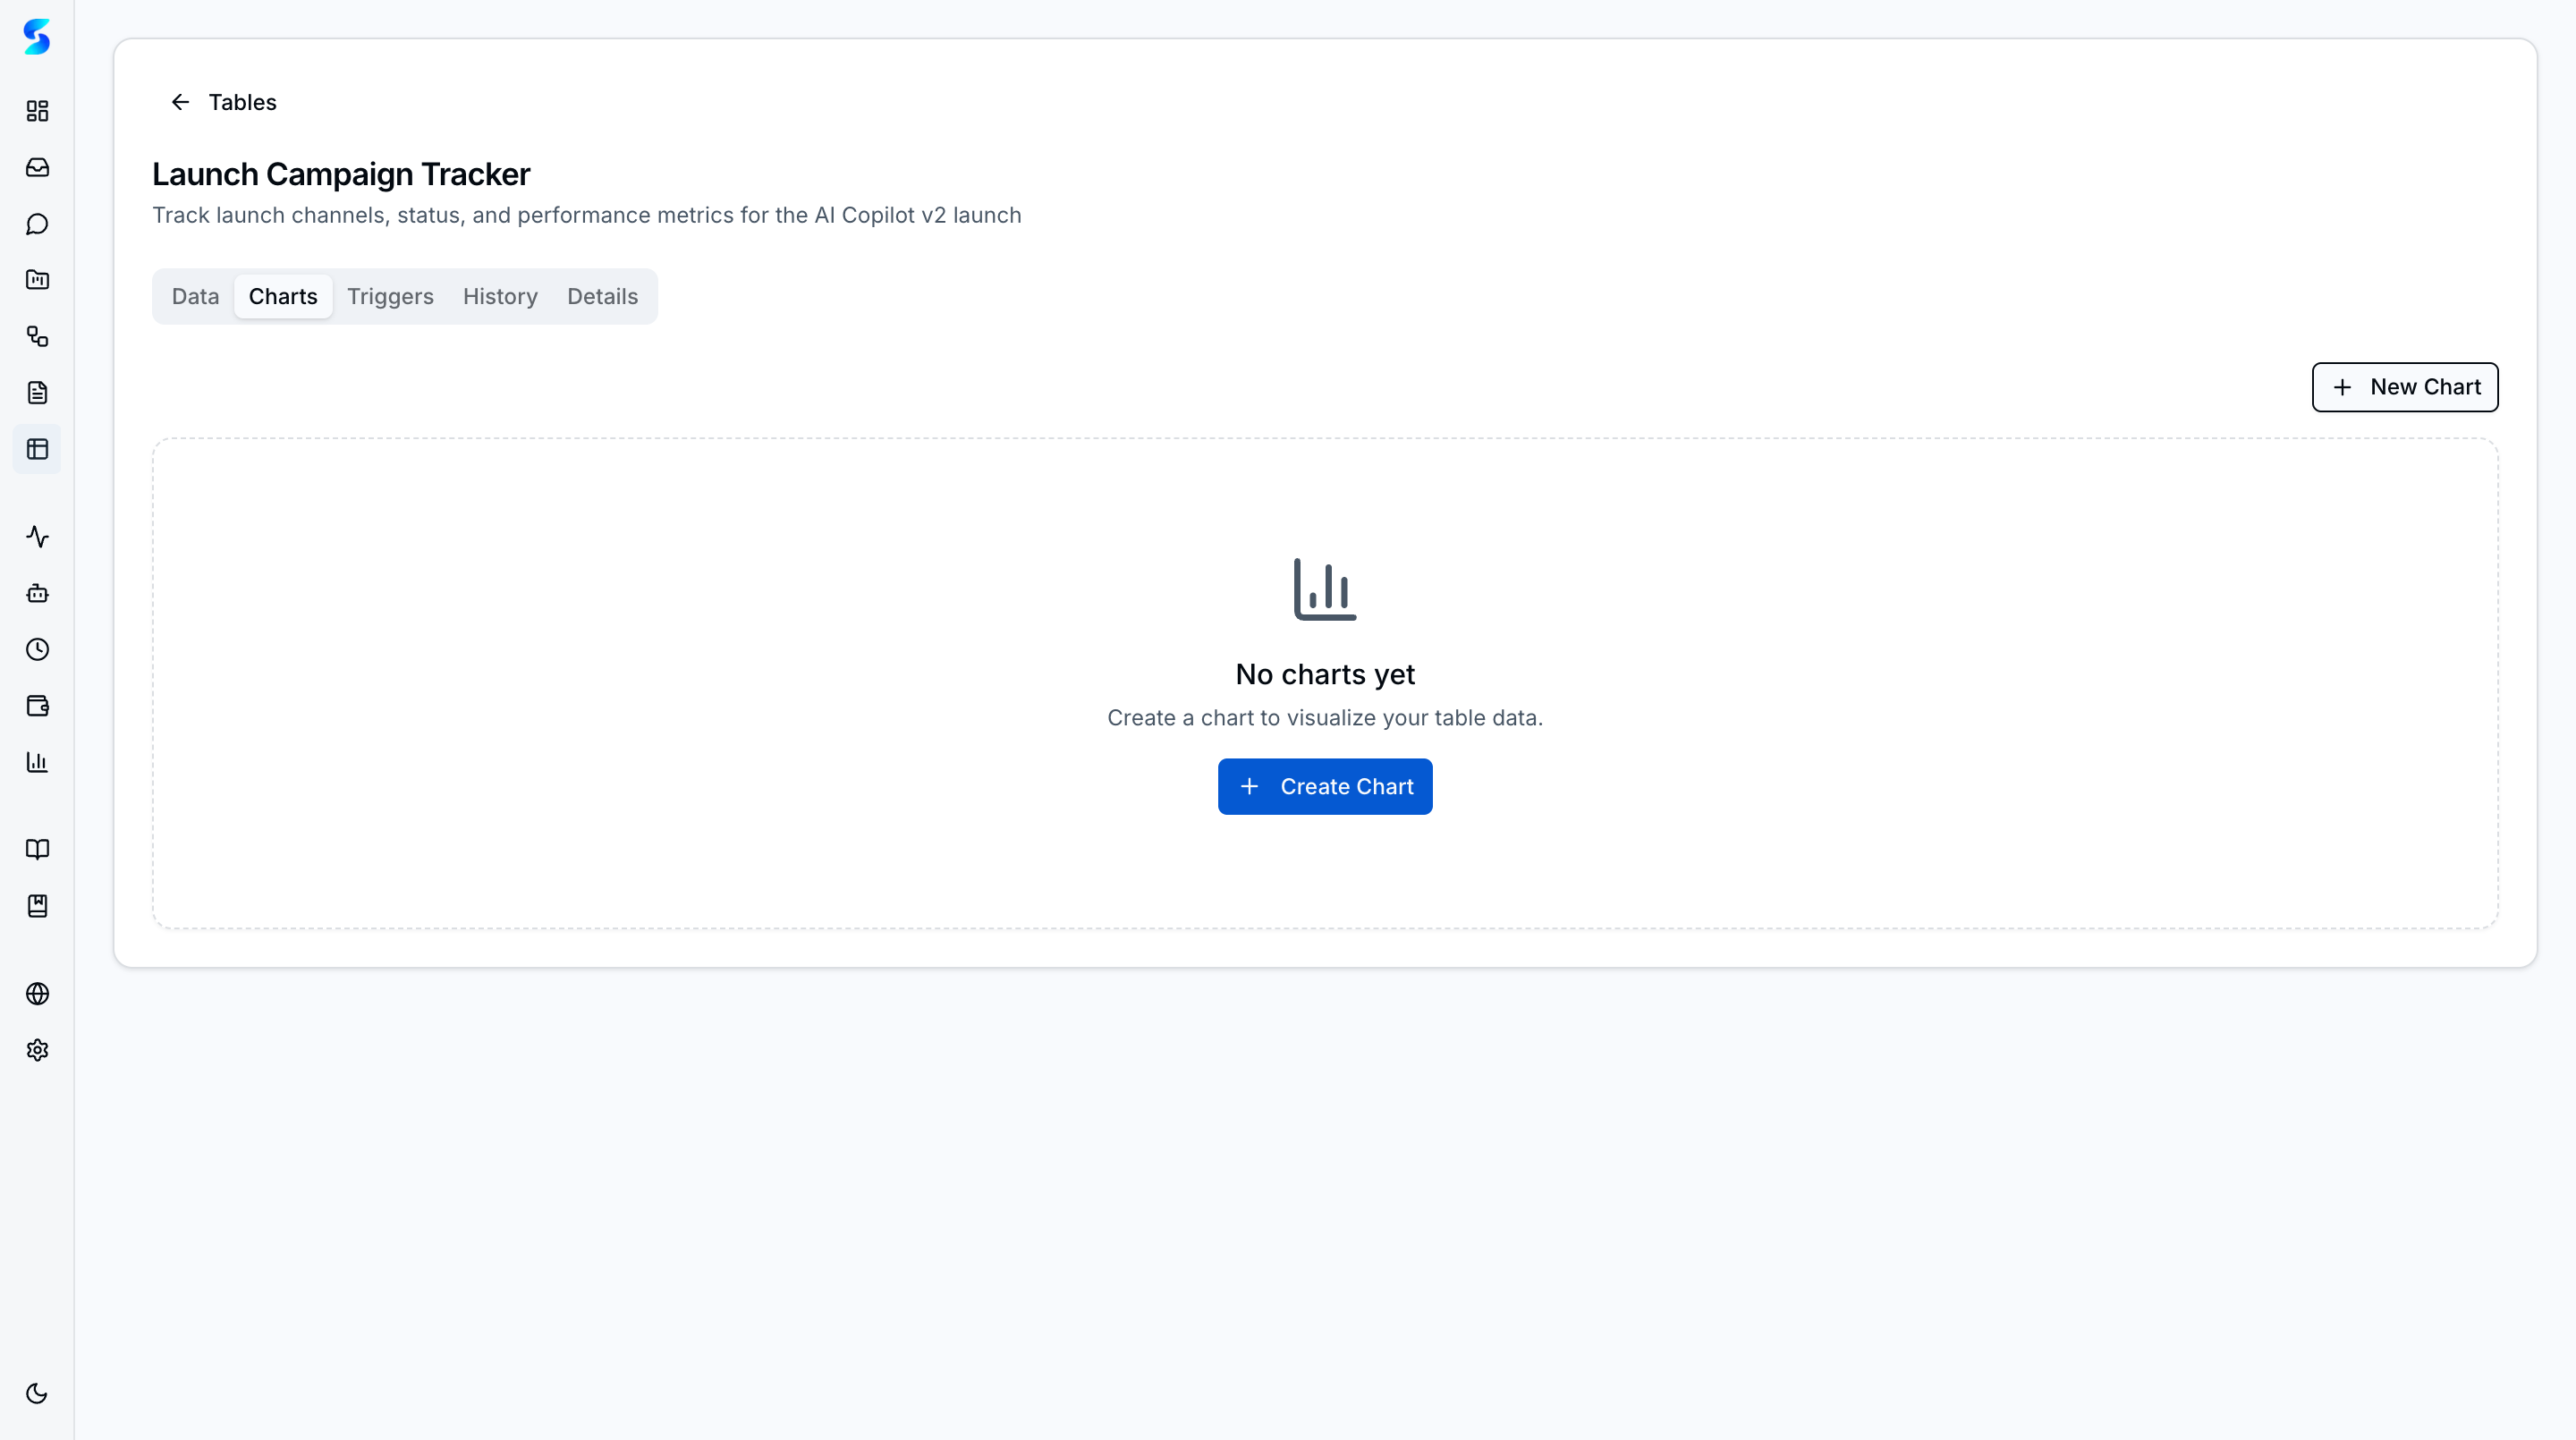 Charts tab showing visual data summaries (bar, line, pie, scatter)
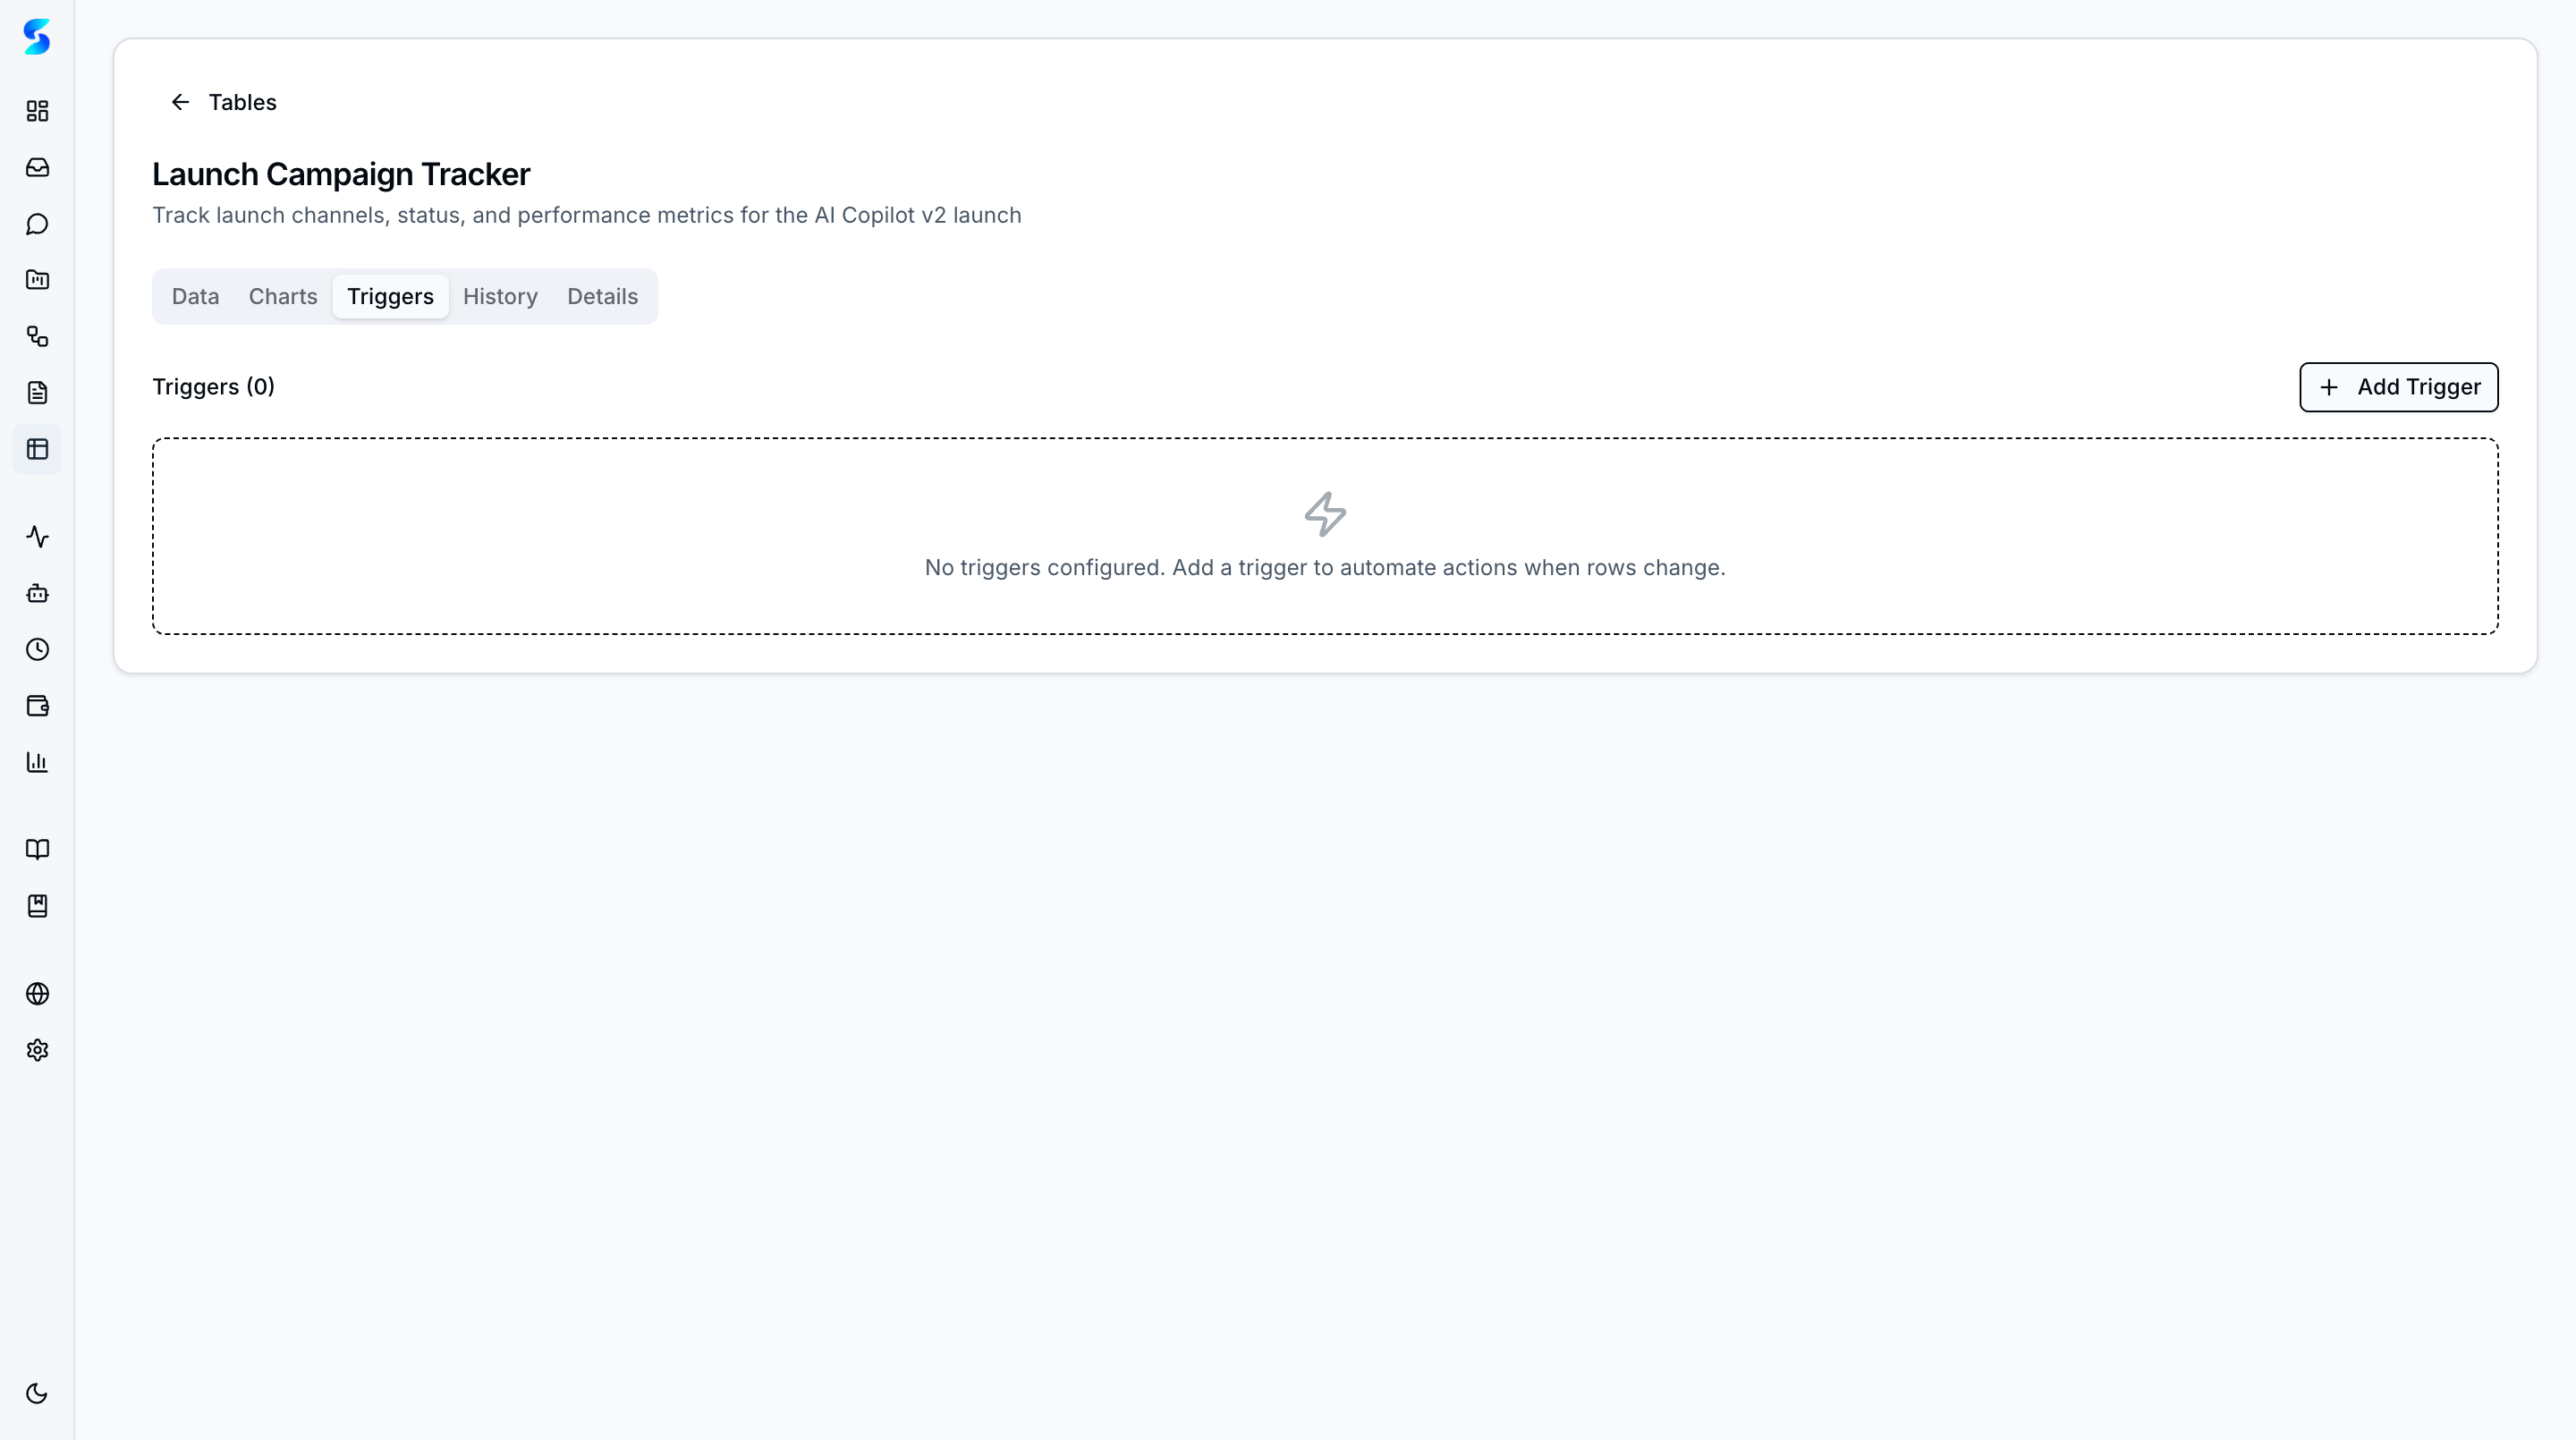 Triggers tab for setting up automated actions based on data changes
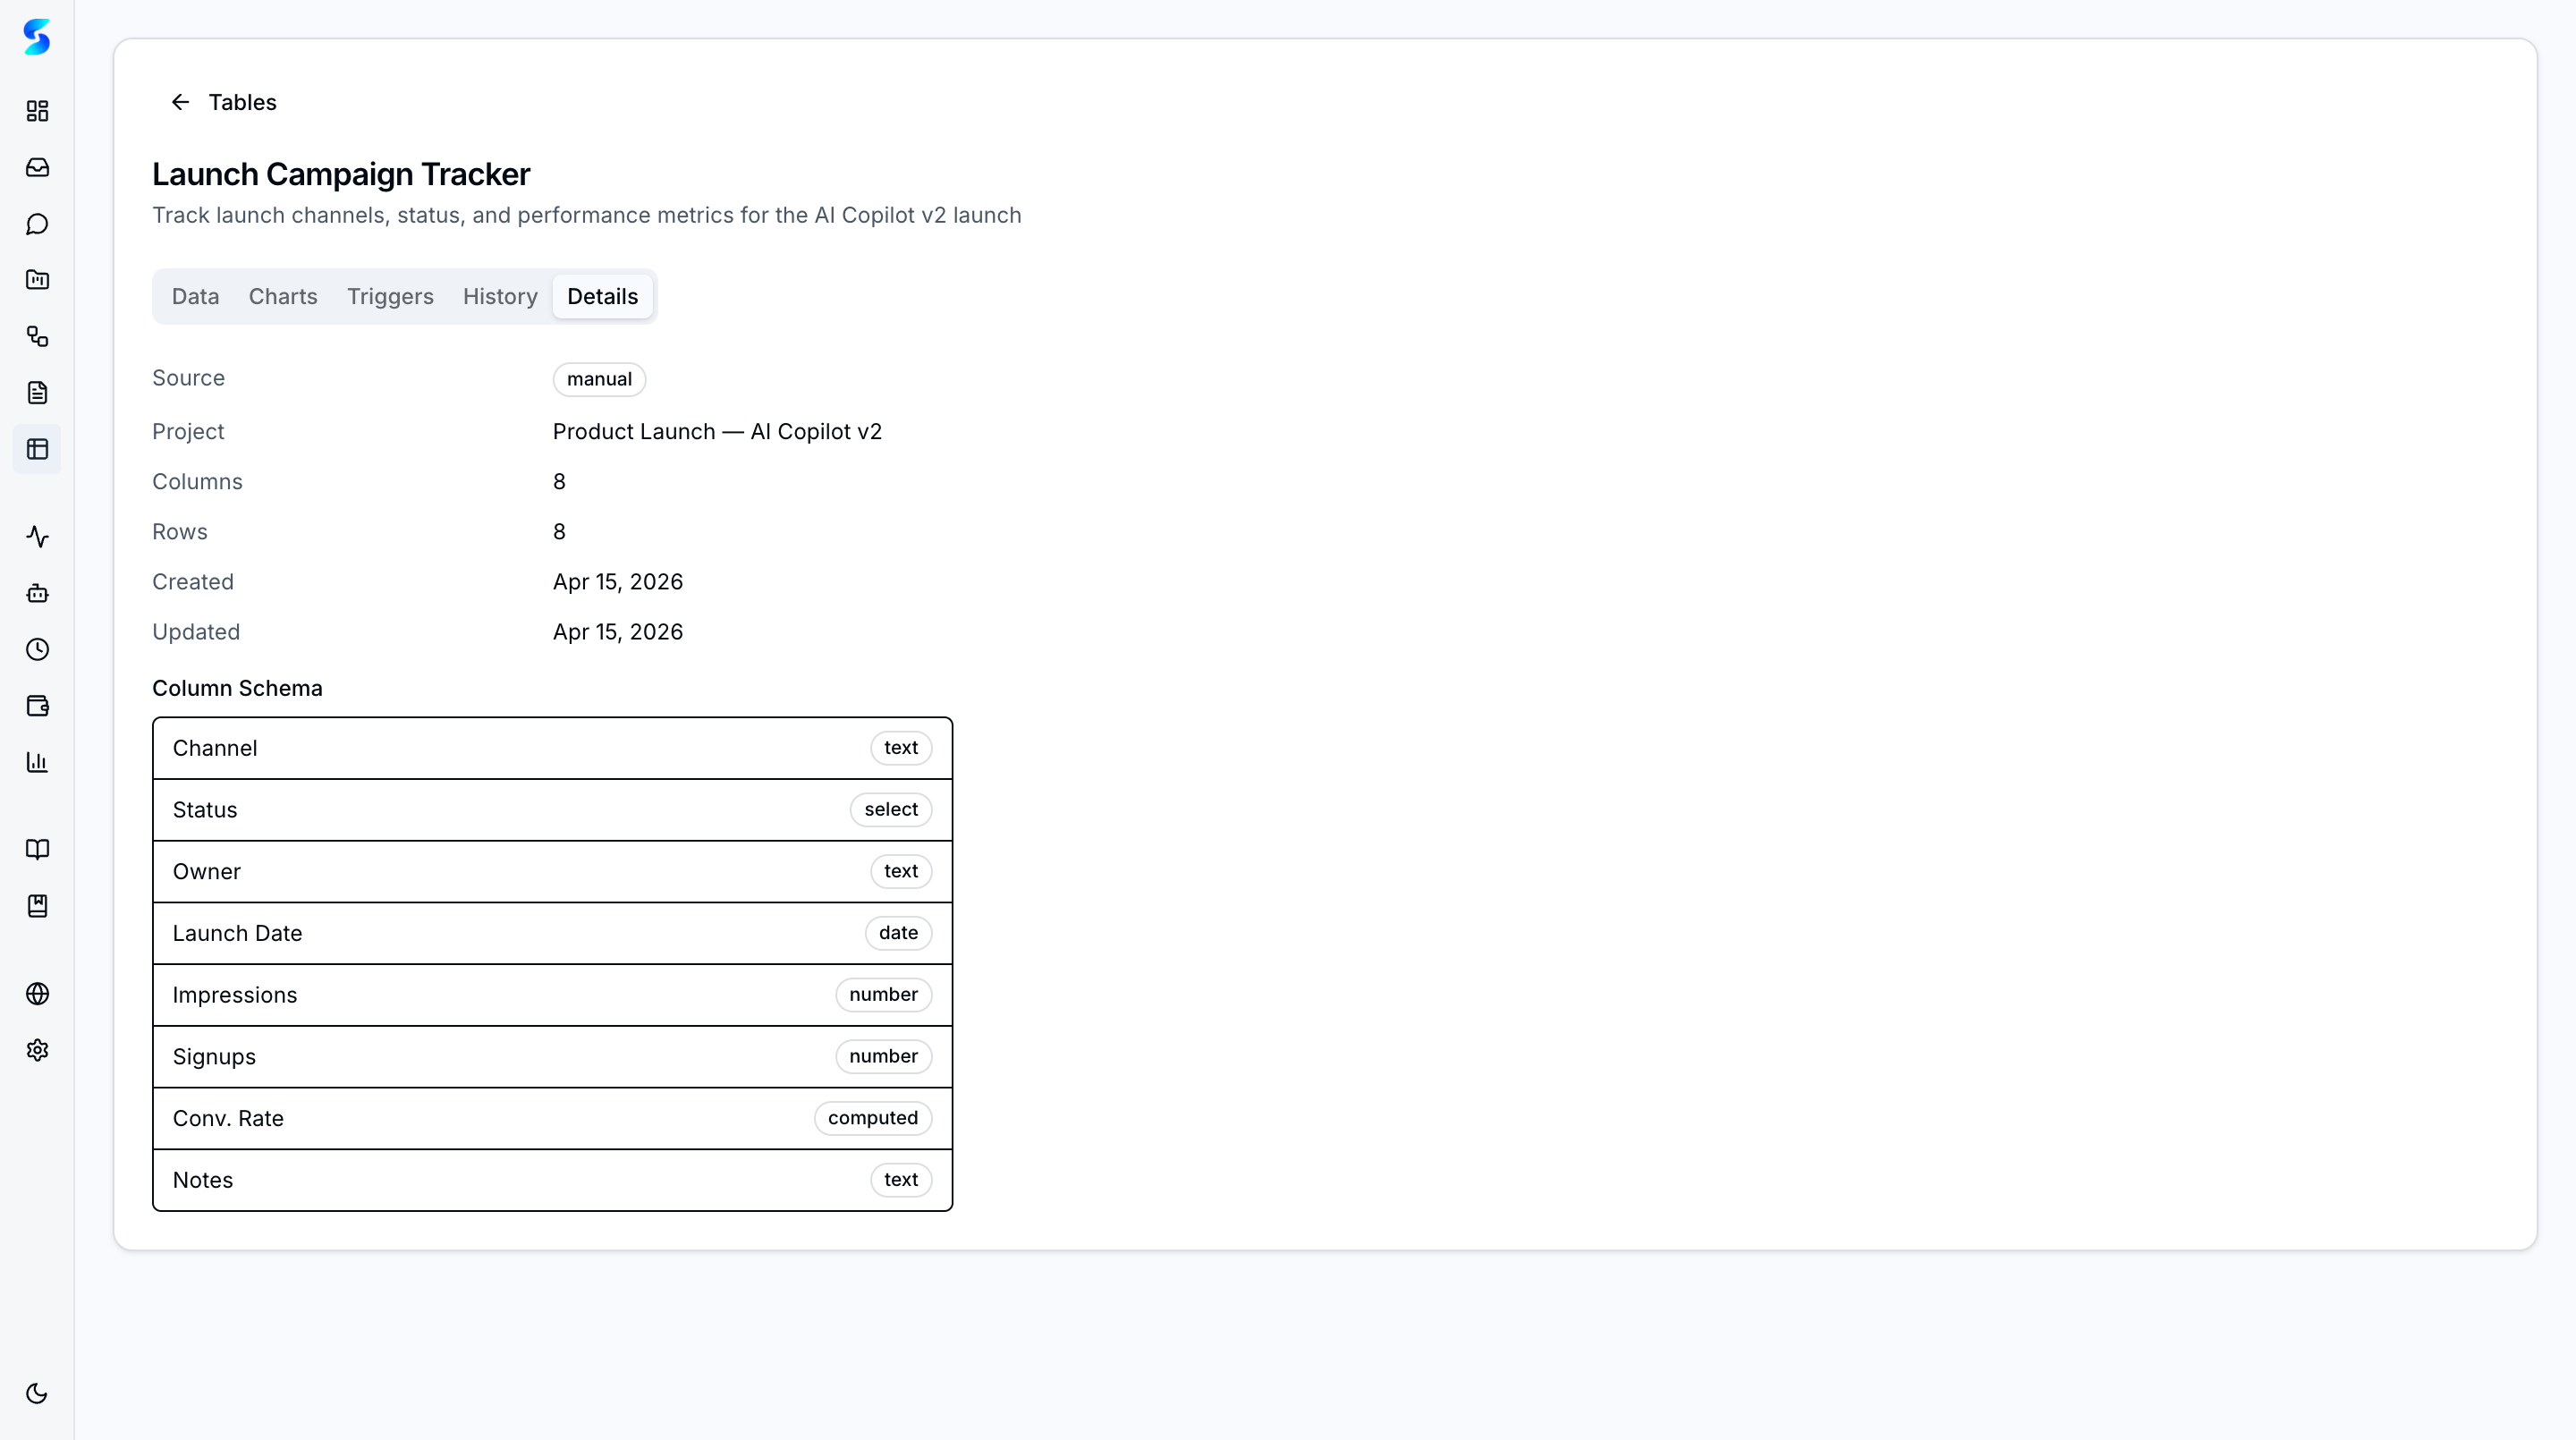 Details tab displaying table metadata, column definitions, and settings
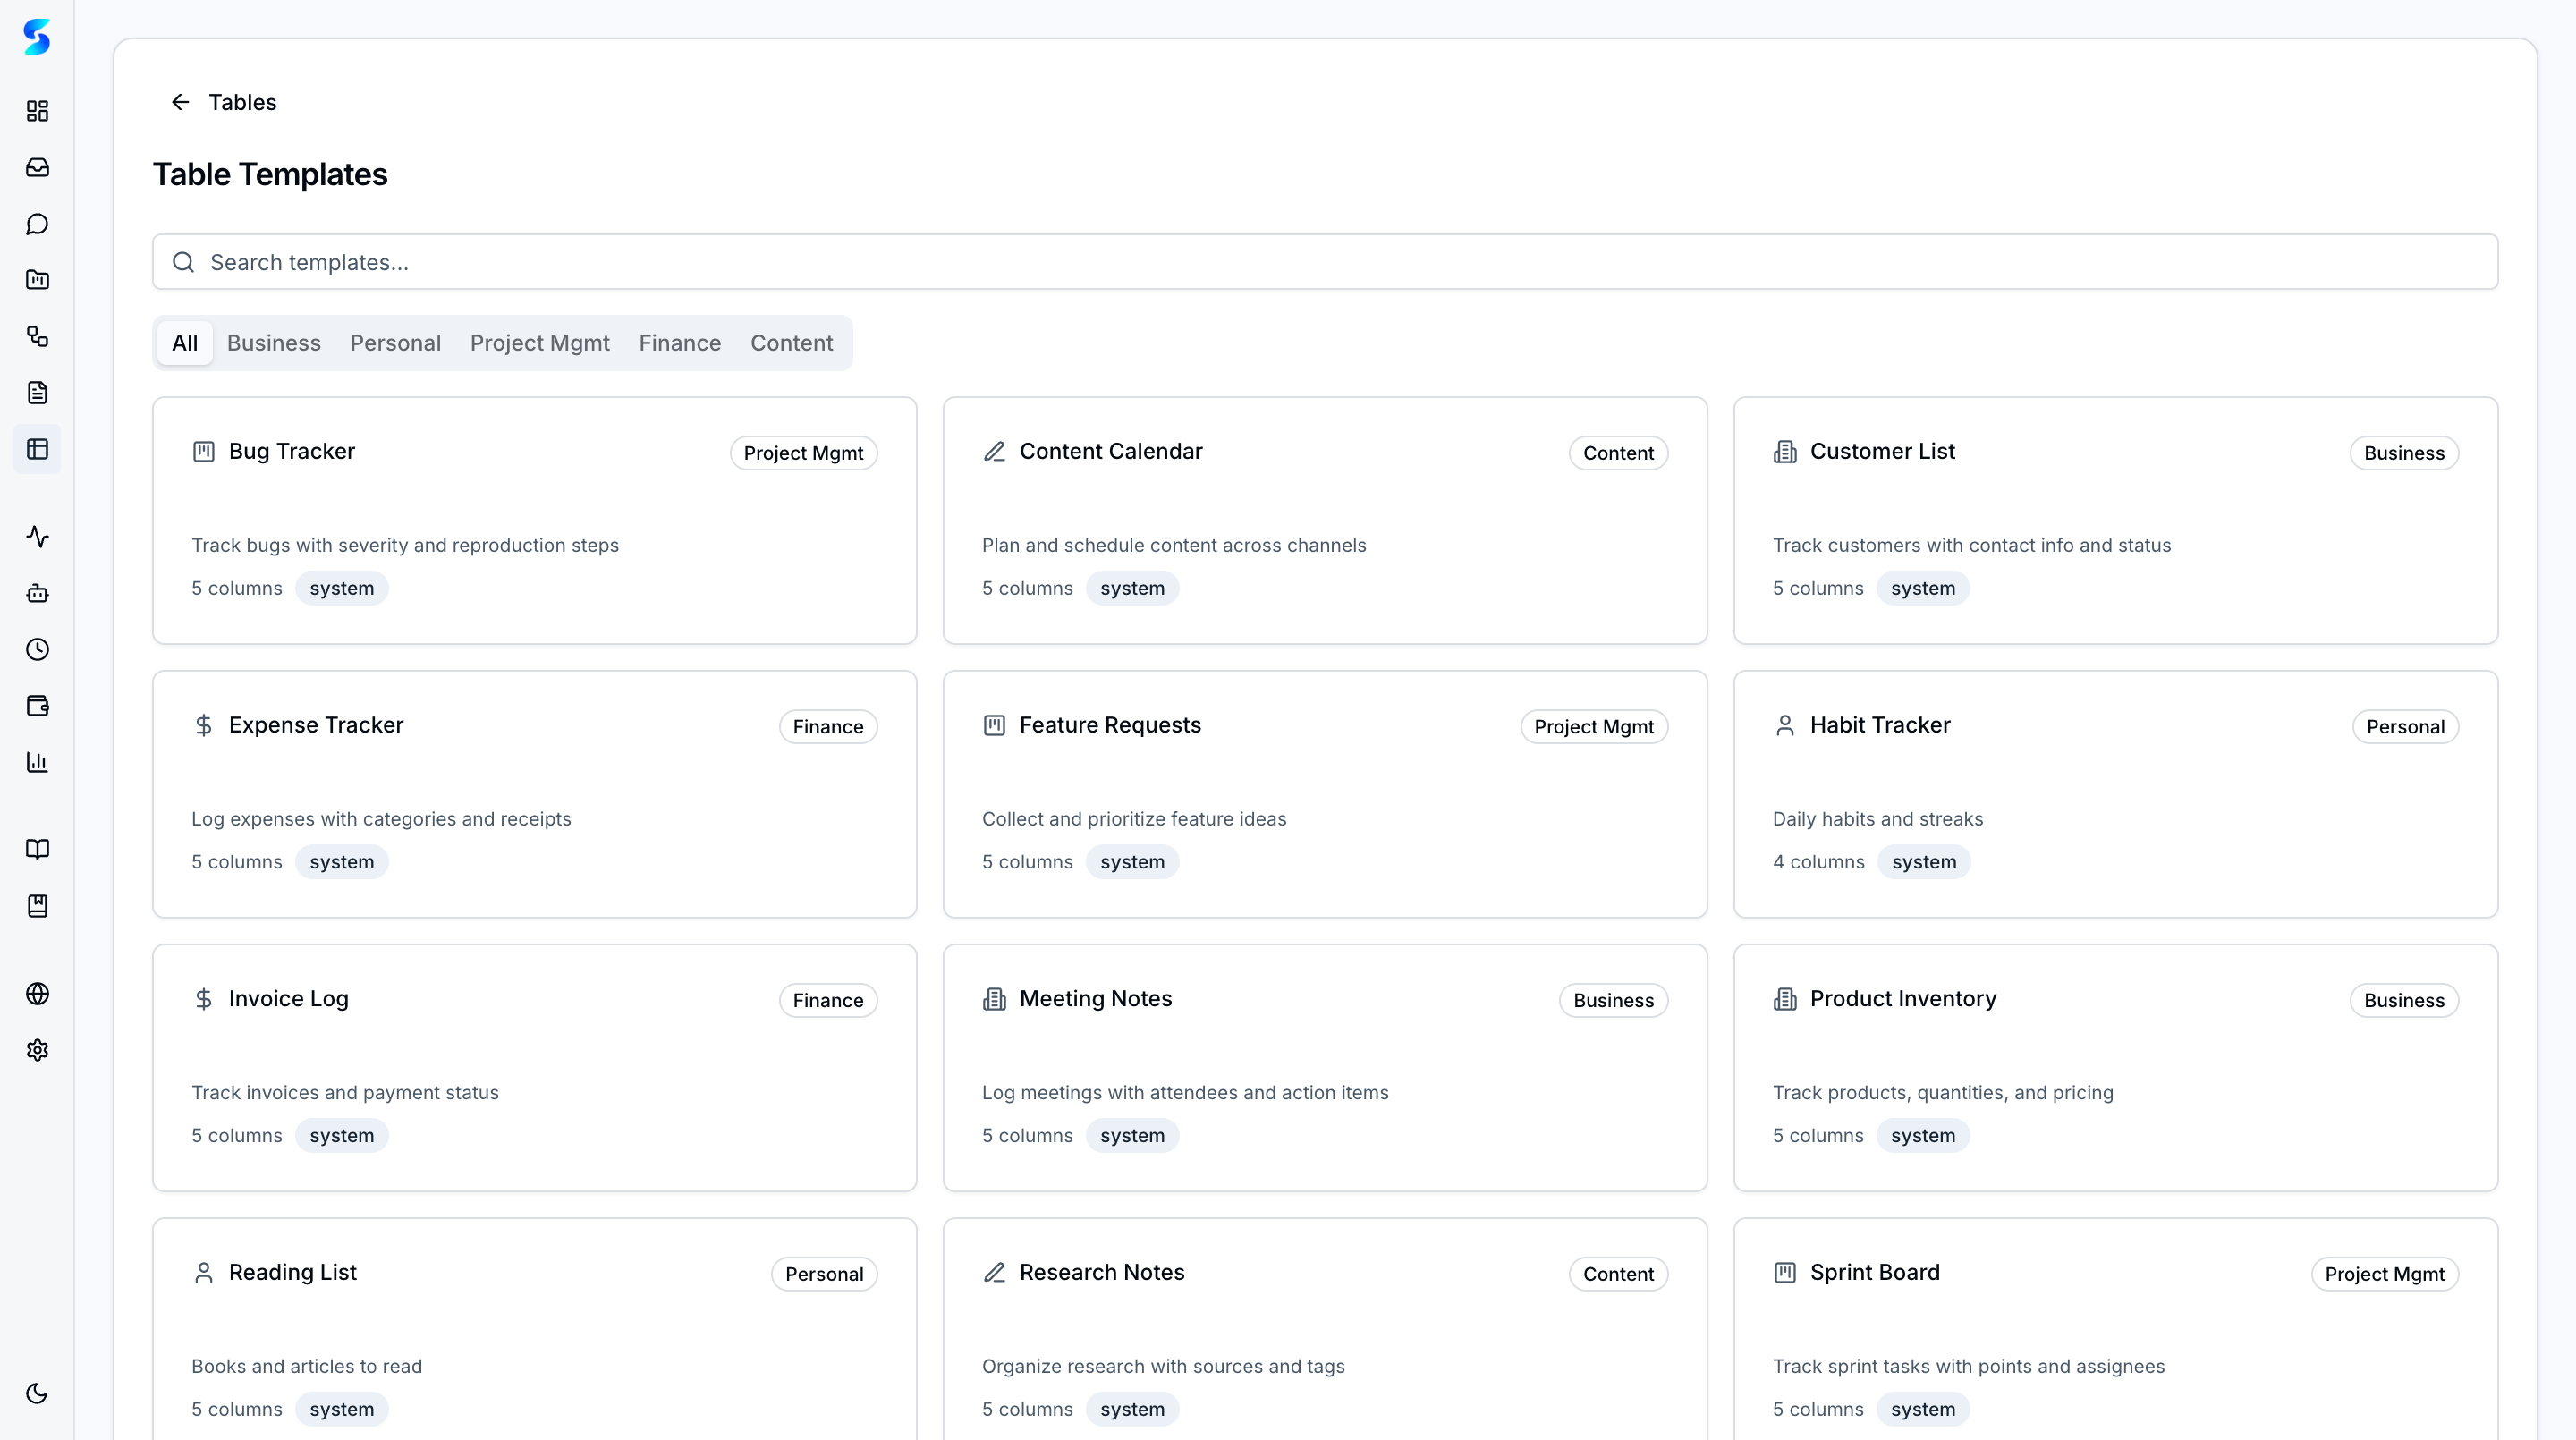 Template gallery with categorized starter tables for common use cases
Key Features
Table and Grid Views
Browse all your tables from the /tables list page. Toggle between a compact table view and a visual grid view. Use the filter bar to narrow by category or search by name. Click any table to open it.
The filter bar uses the shared FilterInput component and the #namespace:value syntax (double-quote values that contain spaces, e.g. #type:"customer list"). Saved filter + query combinations can be pinned as saved searches and recalled from the ⌘K palette under the Saved group — useful for recurring table views like “open orders” or “stale leads.” See the Documents page for a cross-surface reference implementation.
Create Tables
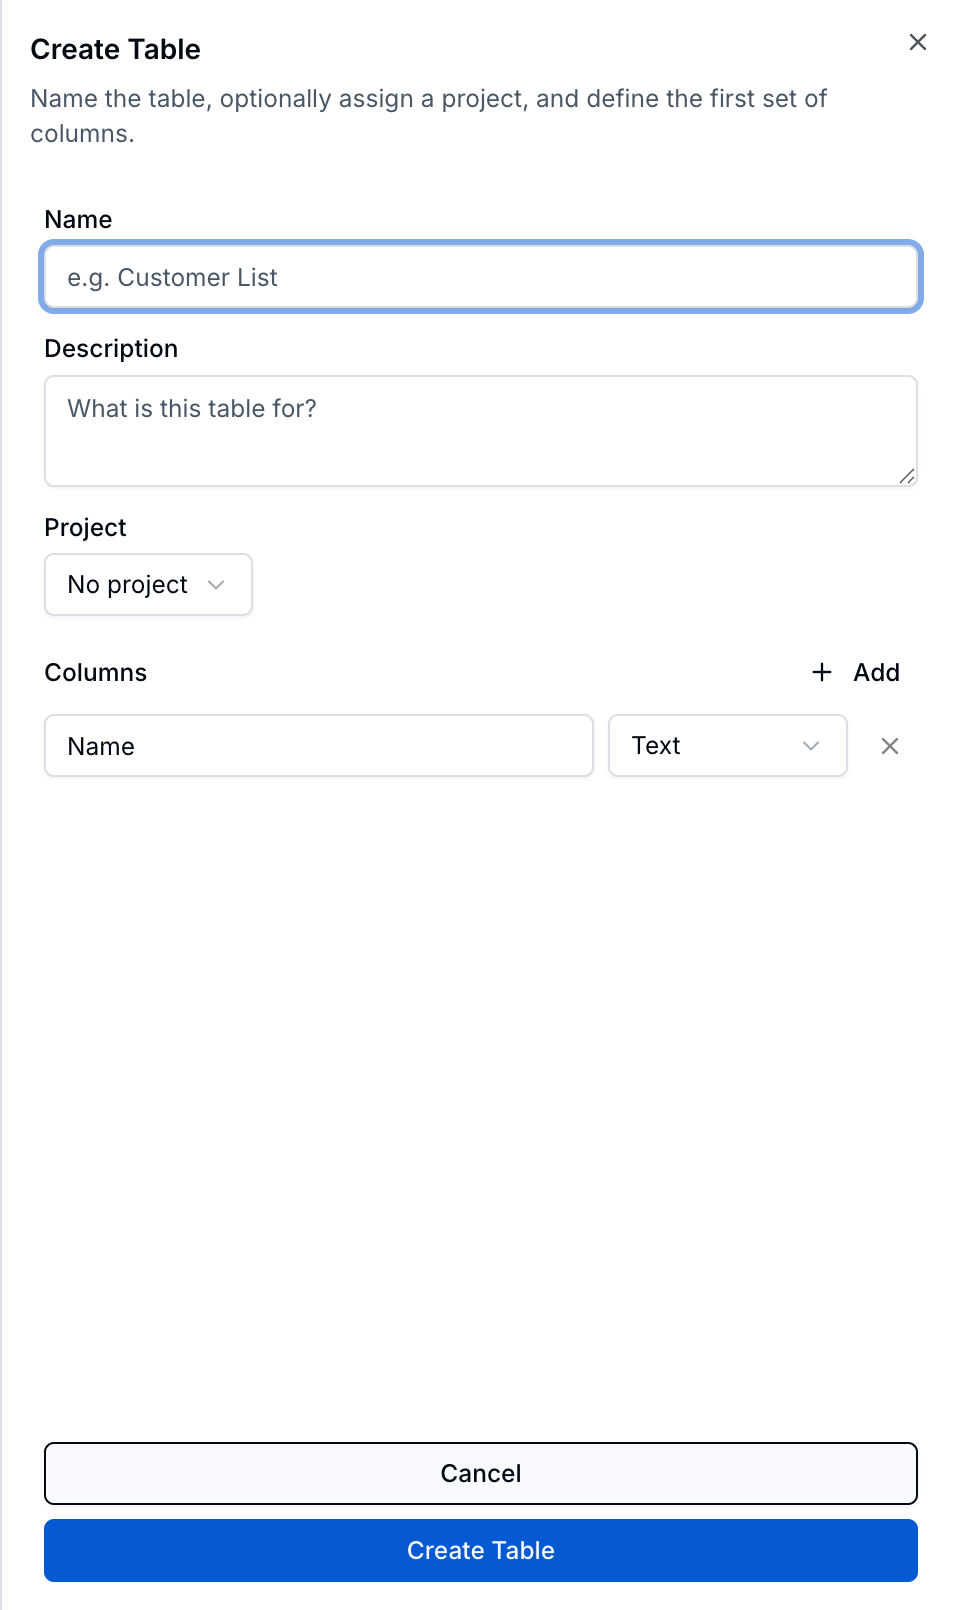 New table dialog with empty name, description, and column builder — set up a fresh table from scratch.
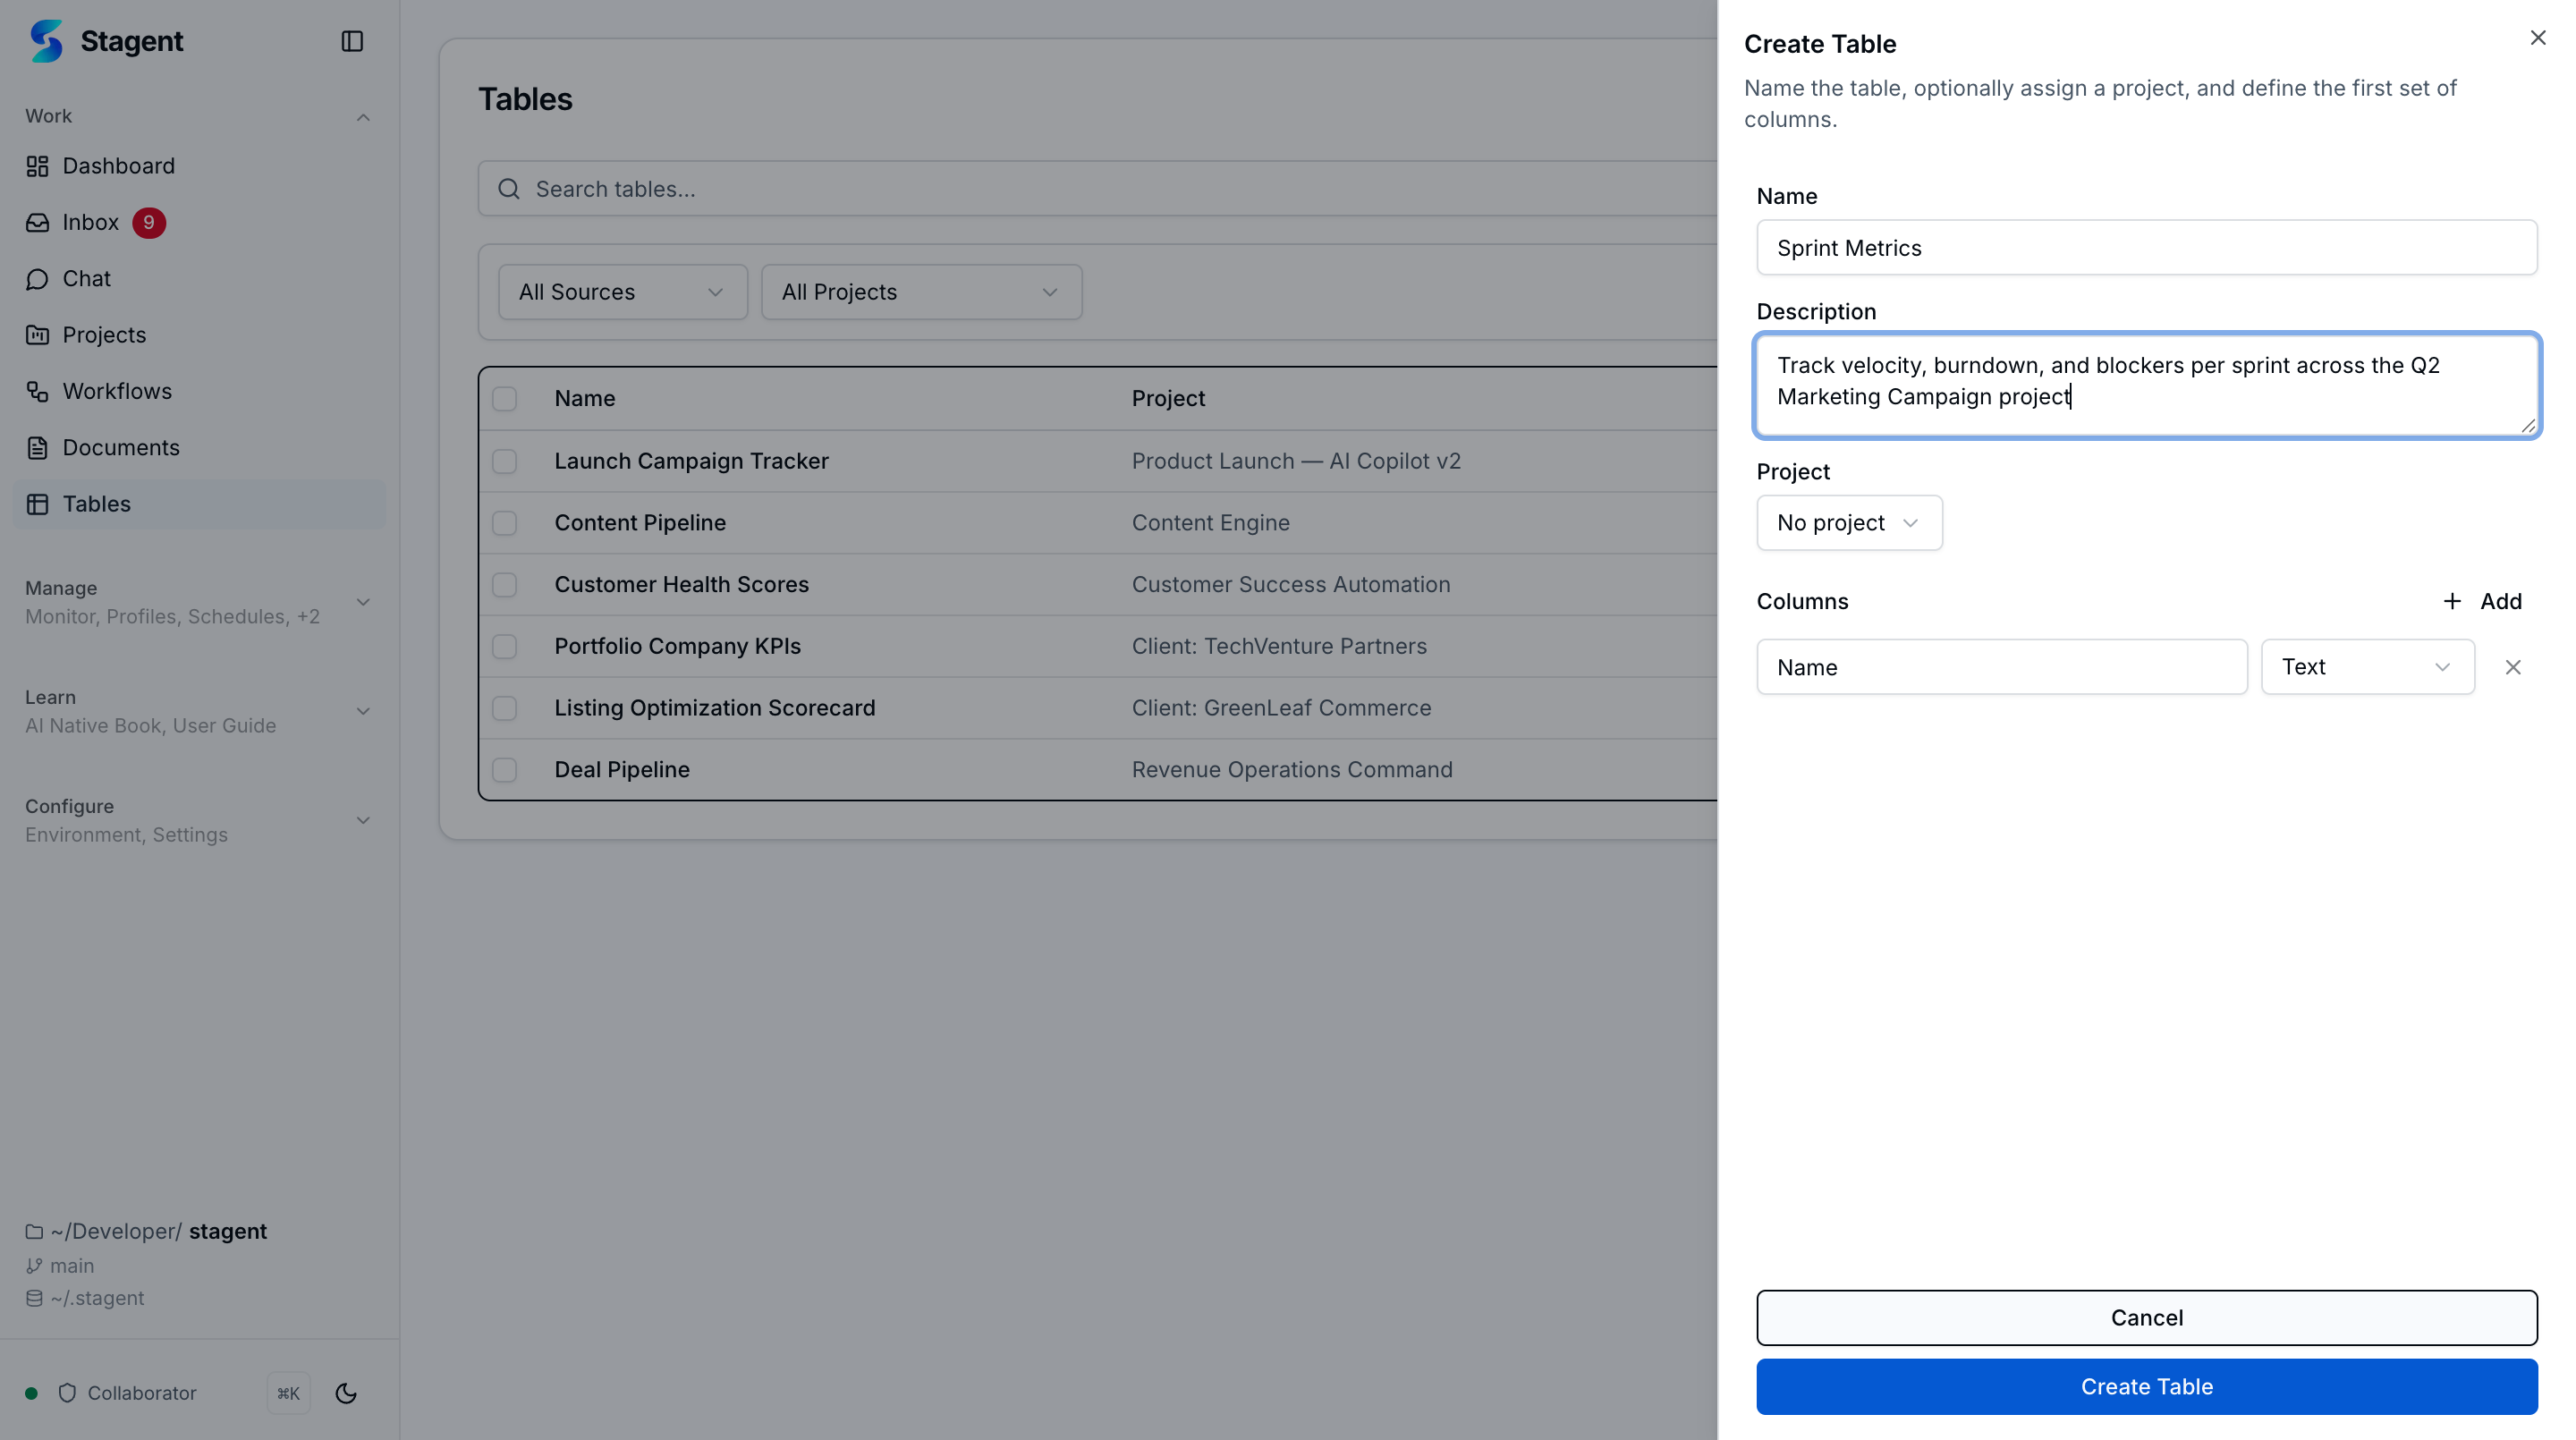 Form filled with a table name, description, and several columns of different types ready to be saved.
Open the create dialog to define a new table with a name, description, and columns. The inline column builder lets you set each column’s name, type, and whether it is required — all before the table is saved. Supported column types include text, number, date, boolean, select (dropdown), URL, email, and computed.
Spreadsheet Editor
The table detail page at /tables/[id] is a full spreadsheet editor. Click any cell to edit it inline. Navigation follows familiar keyboard conventions — arrow keys move between cells, Enter commits an edit, Escape cancels. Each column renders with a type-aware editor: date pickers for dates, checkboxes for booleans, dropdowns for select columns, and validated inputs for URLs and emails. Changes save optimistically so the interface stays fast.
Computed Columns
Add columns with formulas that calculate values from other columns. The formula engine supports 12 built-in functions (SUM, AVG, MIN, MAX, COUNT, IF, CONCAT, and more). Formulas update automatically when referenced data changes, and circular references are detected and blocked.
Document Import
Import data from existing files using the four-step import wizard. Upload a CSV, XLSX, or TSV file, preview the extracted data, review auto-inferred column types, then confirm to create a new table or append rows to an existing one. Column types are detected automatically based on the data content.
Template Gallery
Browse the template gallery at /tables/templates for ready-made table structures organized by category. Preview any template to see its columns and sample data, then clone it into your workspace with one click. Templates cover common business needs — CRMs, project trackers, inventory lists, and more.
Charts
Visualize table data directly from the Charts tab. Build bar, line, pie, or scatter charts by choosing columns for axes and series. Charts are saved alongside the table and update as data changes.
Workflow Triggers
Set up automated triggers from the Triggers tab. Define conditions (e.g., “when Status changes to Done”) and link them to workflows or agent tasks. The trigger evaluator watches for matching row changes and fires the configured action automatically.
Cross-Table Relations
Link rows between tables using relation columns. A searchable combobox lets you pick rows from a target table, creating a live reference. This is useful for connecting related data — linking contacts to companies, tasks to projects, or orders to products.
Agent Integration
Agents have full read-write access to your tables. During task execution, agents can list tables, query rows with filters, aggregate data, insert or update rows, and create new tables. This means you can ask an agent to “summarize Q1 revenue from the Sales table” or “add a row to the Inventory tracker” and it will work directly with your structured data.
Natural-Language Table Creation
Ask an agent to create a table by describing what you need in plain language. For example, “create a table to track job applicants with name, email, resume link, stage, and rating” will produce a fully structured table with appropriate column types.
Export
Export any table to CSV, XLSX, or JSON. Use export to share data with external tools, create backups, or feed downstream processes.
Row History and Versioning
Every row edit is tracked. The History tab shows a timeline of changes, and you can roll back any row to a previous version if a mistake is made.
How To
Create a Table from Scratch
- Navigate to
/tablesand click “New Table.” - Enter a name and optional description.
- Add columns using the inline column builder — set a name, choose a type, and mark required columns.
- Click “Create” to save the table.
- Start adding rows directly in the spreadsheet editor.
Import Data from a File
- From the tables list, click “Import.”
- Upload a CSV, XLSX, or TSV file.
- Preview the extracted rows and review the auto-detected column types.
- Adjust column names or types if needed.
- Confirm to create the table with your imported data.
Create a Table from a Template
- Go to
/tables/templates. - Browse categories or search for a template.
- Click a template card to preview its structure and sample data.
- Click “Use Template” to clone it into your workspace.
Add a Chart
- Open a table and switch to the Charts tab.
- Click “Add Chart” and choose a chart type (bar, line, pie, or scatter).
- Select the columns for axes and data series.
- Save the chart — it will update automatically as table data changes.
Set Up a Trigger
- Open a table and switch to the Triggers tab.
- Click “Add Trigger.”
- Define the condition (e.g., column value equals, changes to, or exceeds a threshold).
- Choose the action — run a workflow or start an agent task.
- Save the trigger. It will fire automatically when matching row changes occur.
Ask an Agent to Work with Table Data
- Create a task and mention a table by name in the prompt (e.g., “Query the Sales Pipeline table for deals closing this month”).
- The agent will use its table tools to read, filter, aggregate, or update the data as needed.
- Results appear in the task output, and any row changes are reflected in the table immediately.
Bulk Row Enrichment
Enrich every matching row in a table by generating a loop workflow that iterates over the rows and writes results back via a postAction. Trigger it two ways:
- From chat: ask “enrich the Leads table with a one-line company summary for each row” — the
enrich_tablechat tool plans a loop workflow scoped to the matching rows. - From the Tables API:
POST /api/tables/:id/enrichwith a prompt, target column, and optional row filter.
Each iteration binds the current row’s fields as {{row.field}} in the prompt template, so the agent sees only that row’s context. Execution is sequential (not parallel) to keep the spend budget predictable, and the loop is idempotent — already-populated cells are skipped on re-run so you can safely resume an interrupted enrichment. The generated workflow appears in the Workflows list so you can watch progress, pause, or inspect per-row results.
Related
- Documents — Upload files and attach them to tasks for agent context.
- Workflows — Automate multi-step processes that can read from and write to tables.
- Schedules — Run recurring tasks that interact with table data on a schedule.
- Profiles — Agent profiles that determine how agents interact with your data.