Monitoring
The monitor is ainative-business’s real-time execution feed. It complements the inbox by showing what agents are doing right now, not just the points where they need human input.
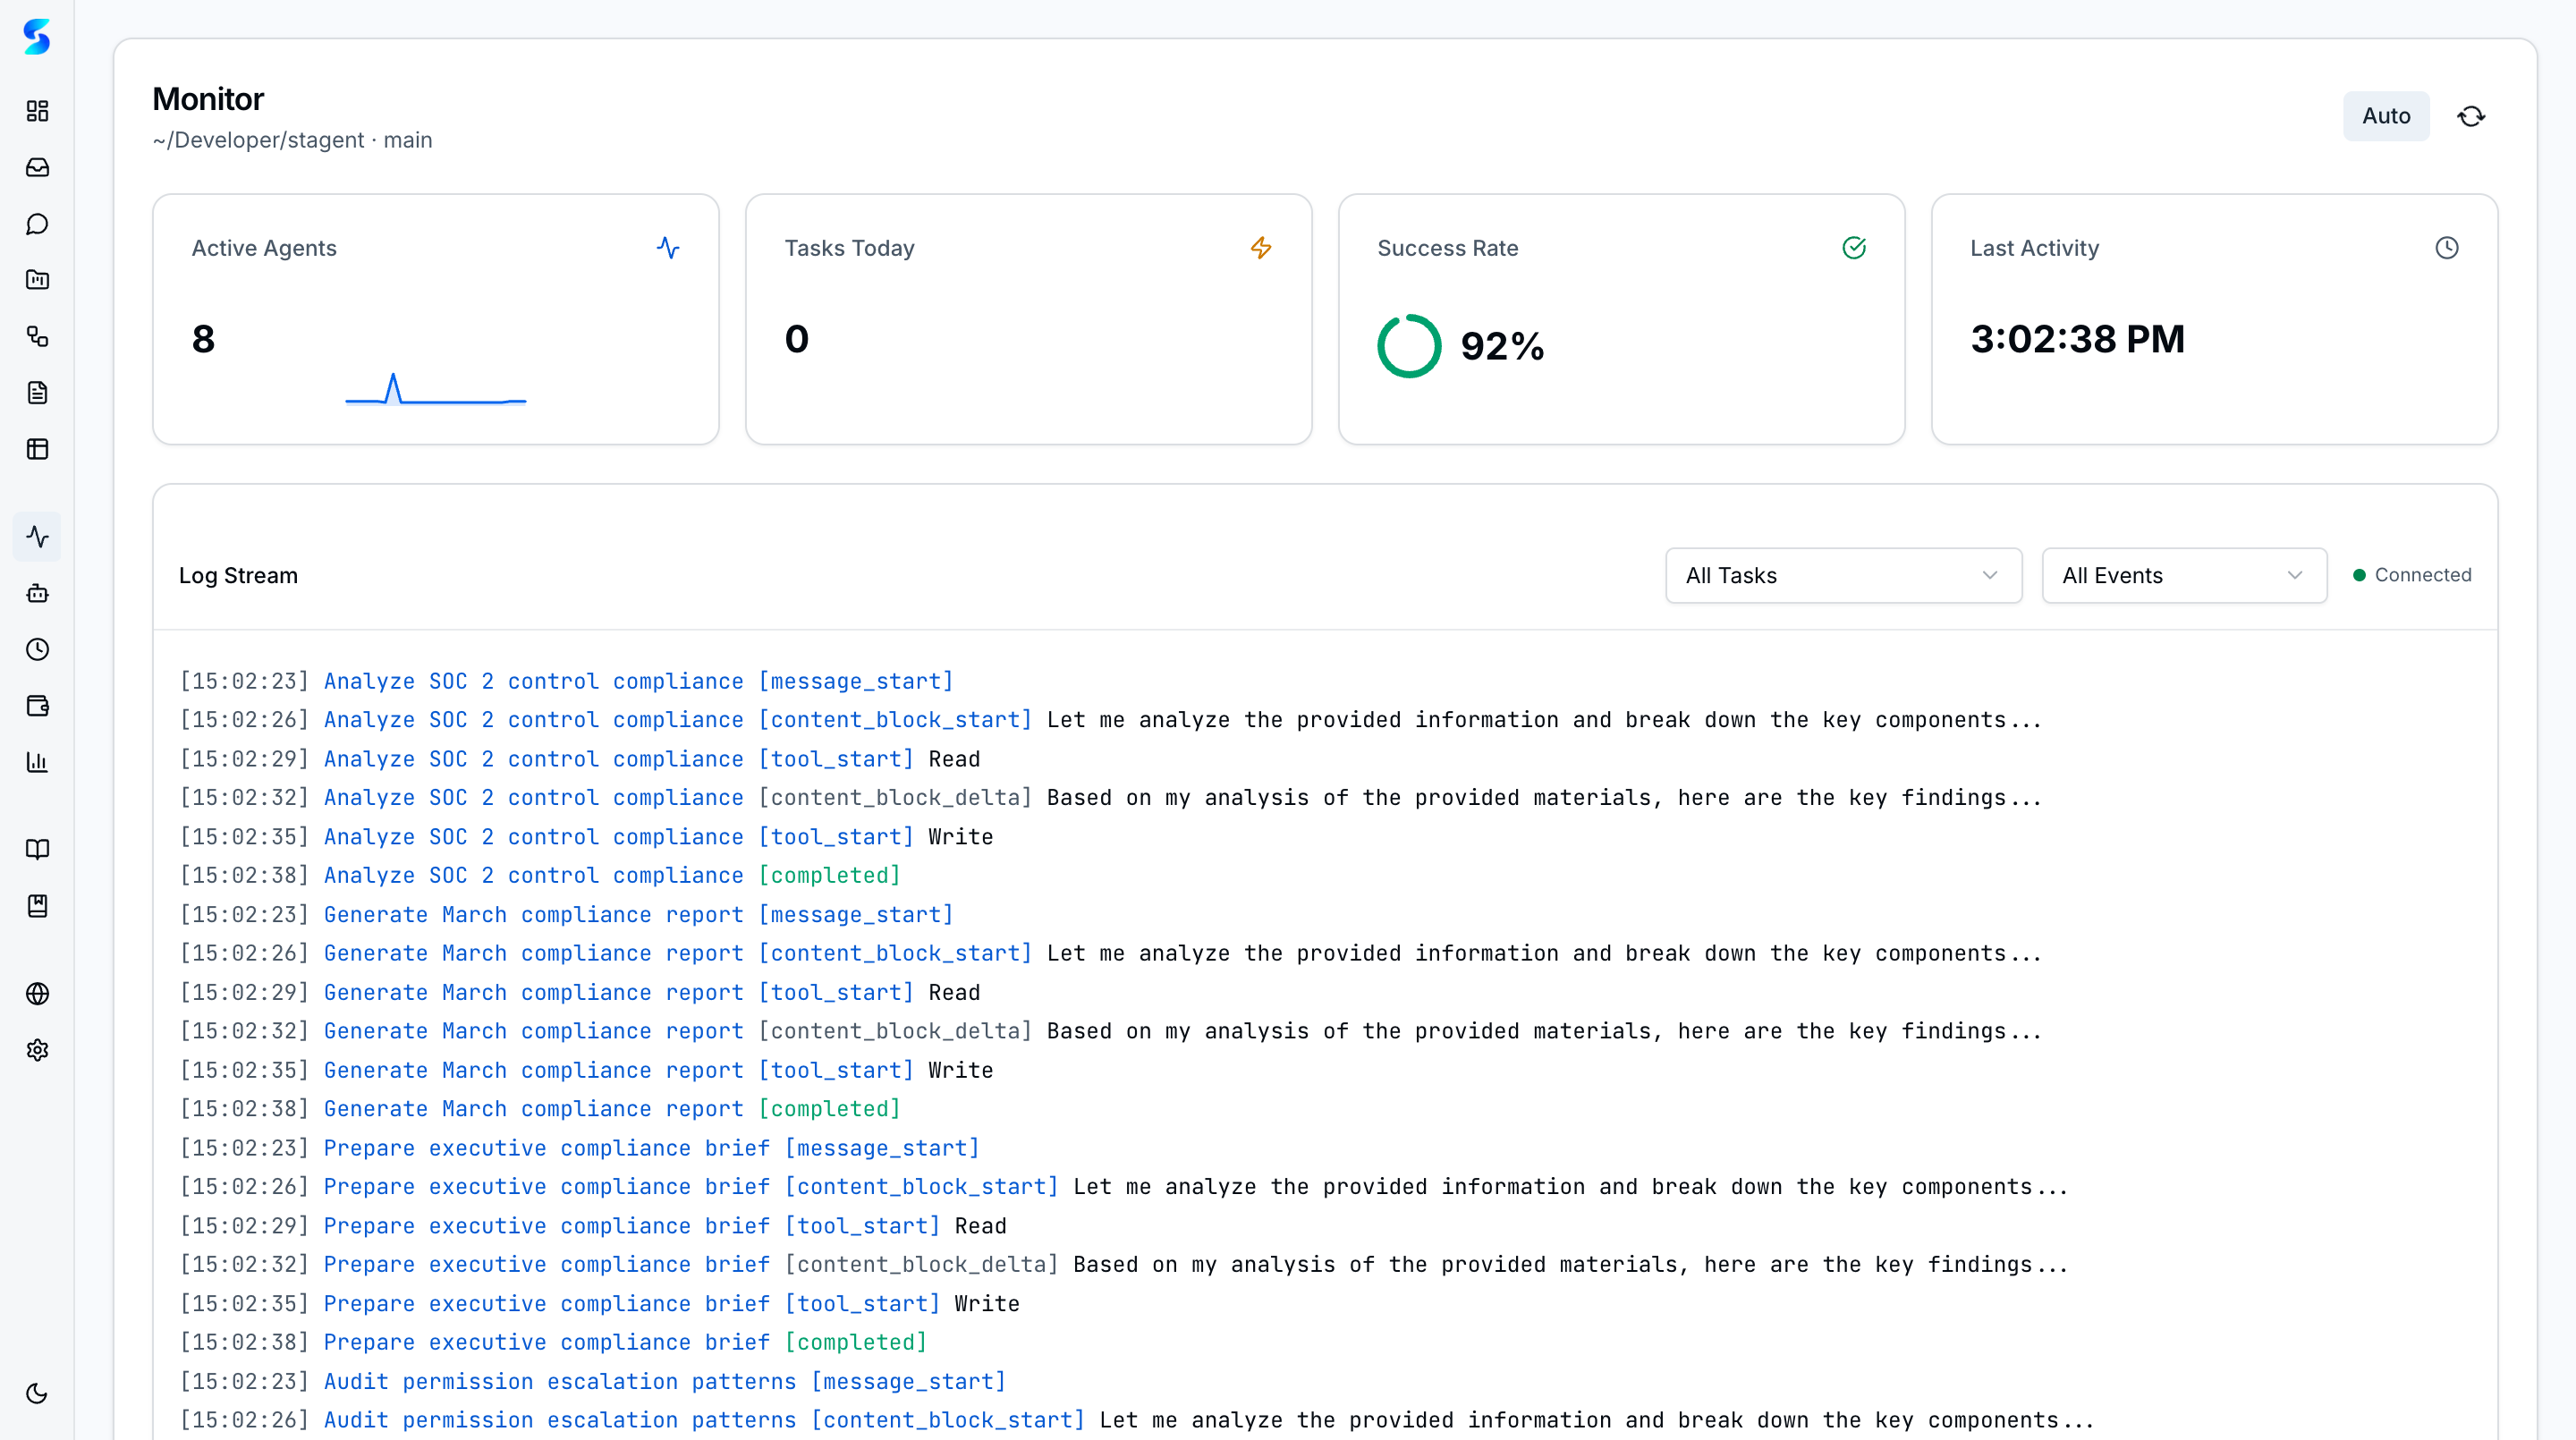
Real-time agent activity monitoring for all running tasks in your workspace. The monitoring dashboard provides a live view of agent logs with timestamps, task associations, and status indicators, giving you full visibility into what your agents are doing at any moment.
Screenshots
The monitoring dashboard displays a chronological feed of agent activity with status indicators and task associations.
Key Features
Real-Time Activity Feed
The monitoring dashboard streams agent log entries as they happen. Each log entry includes a timestamp, the associated task name, the agent profile performing the work, and a status indicator showing whether the operation succeeded, failed, or is still in progress.
Task Association Tracking
Every log entry is linked to its parent task, making it easy to trace agent activity back to the work item that triggered it. Click any task reference to jump directly to the task detail view.
Status Indicators
Visual status badges distinguish between different activity states: running operations appear with an active indicator, completed work shows a success badge, and errors are highlighted with a destructive badge for immediate visibility.
Execution Progress Monitoring
Track the progress of long-running agent executions across all active tasks. The dashboard aggregates activity from every running agent, providing a single pane of glass for workspace-wide oversight.
Error Detection
Failed operations and agent errors surface prominently in the activity feed. Error entries include the error message and context, enabling quick diagnosis without needing to dig into individual task logs.
How To
Monitor Active Agents
- Navigate to
/monitorfrom the sidebar under the Observe group. - The activity feed loads automatically with the most recent log entries.
- New entries appear at the top of the feed in real time as agents execute tasks.
Investigate an Error
- Look for log entries with a destructive (red) status badge in the activity feed.
- Read the error message displayed in the log entry detail.
- Click the associated task name to navigate to the full task detail view.
- Review the complete execution log for additional context.
Filter by Task
- Open the monitoring dashboard at
/monitor. - Use the task association links to identify activity related to a specific task.
- Click through to the task detail page for the complete execution history of that task.
Related
Related Features
- Agent Integration — Where logs are generated
- Human-in-the-Loop — Permission requests that appear during monitoring
- Task Execution — Task context for filtered views