Cost & Usage
The cost and usage view gives operators a shared ledger across all five provider runtimes — Claude Agent SDK, Anthropic Direct API, Codex App Server, OpenAI Direct API, and Ollama (tracked at $0). Instead of inferring spend from provider-specific logs, ainative-business surfaces spend, tokens, budget health, runtime share, and model concentration in one governed screen.
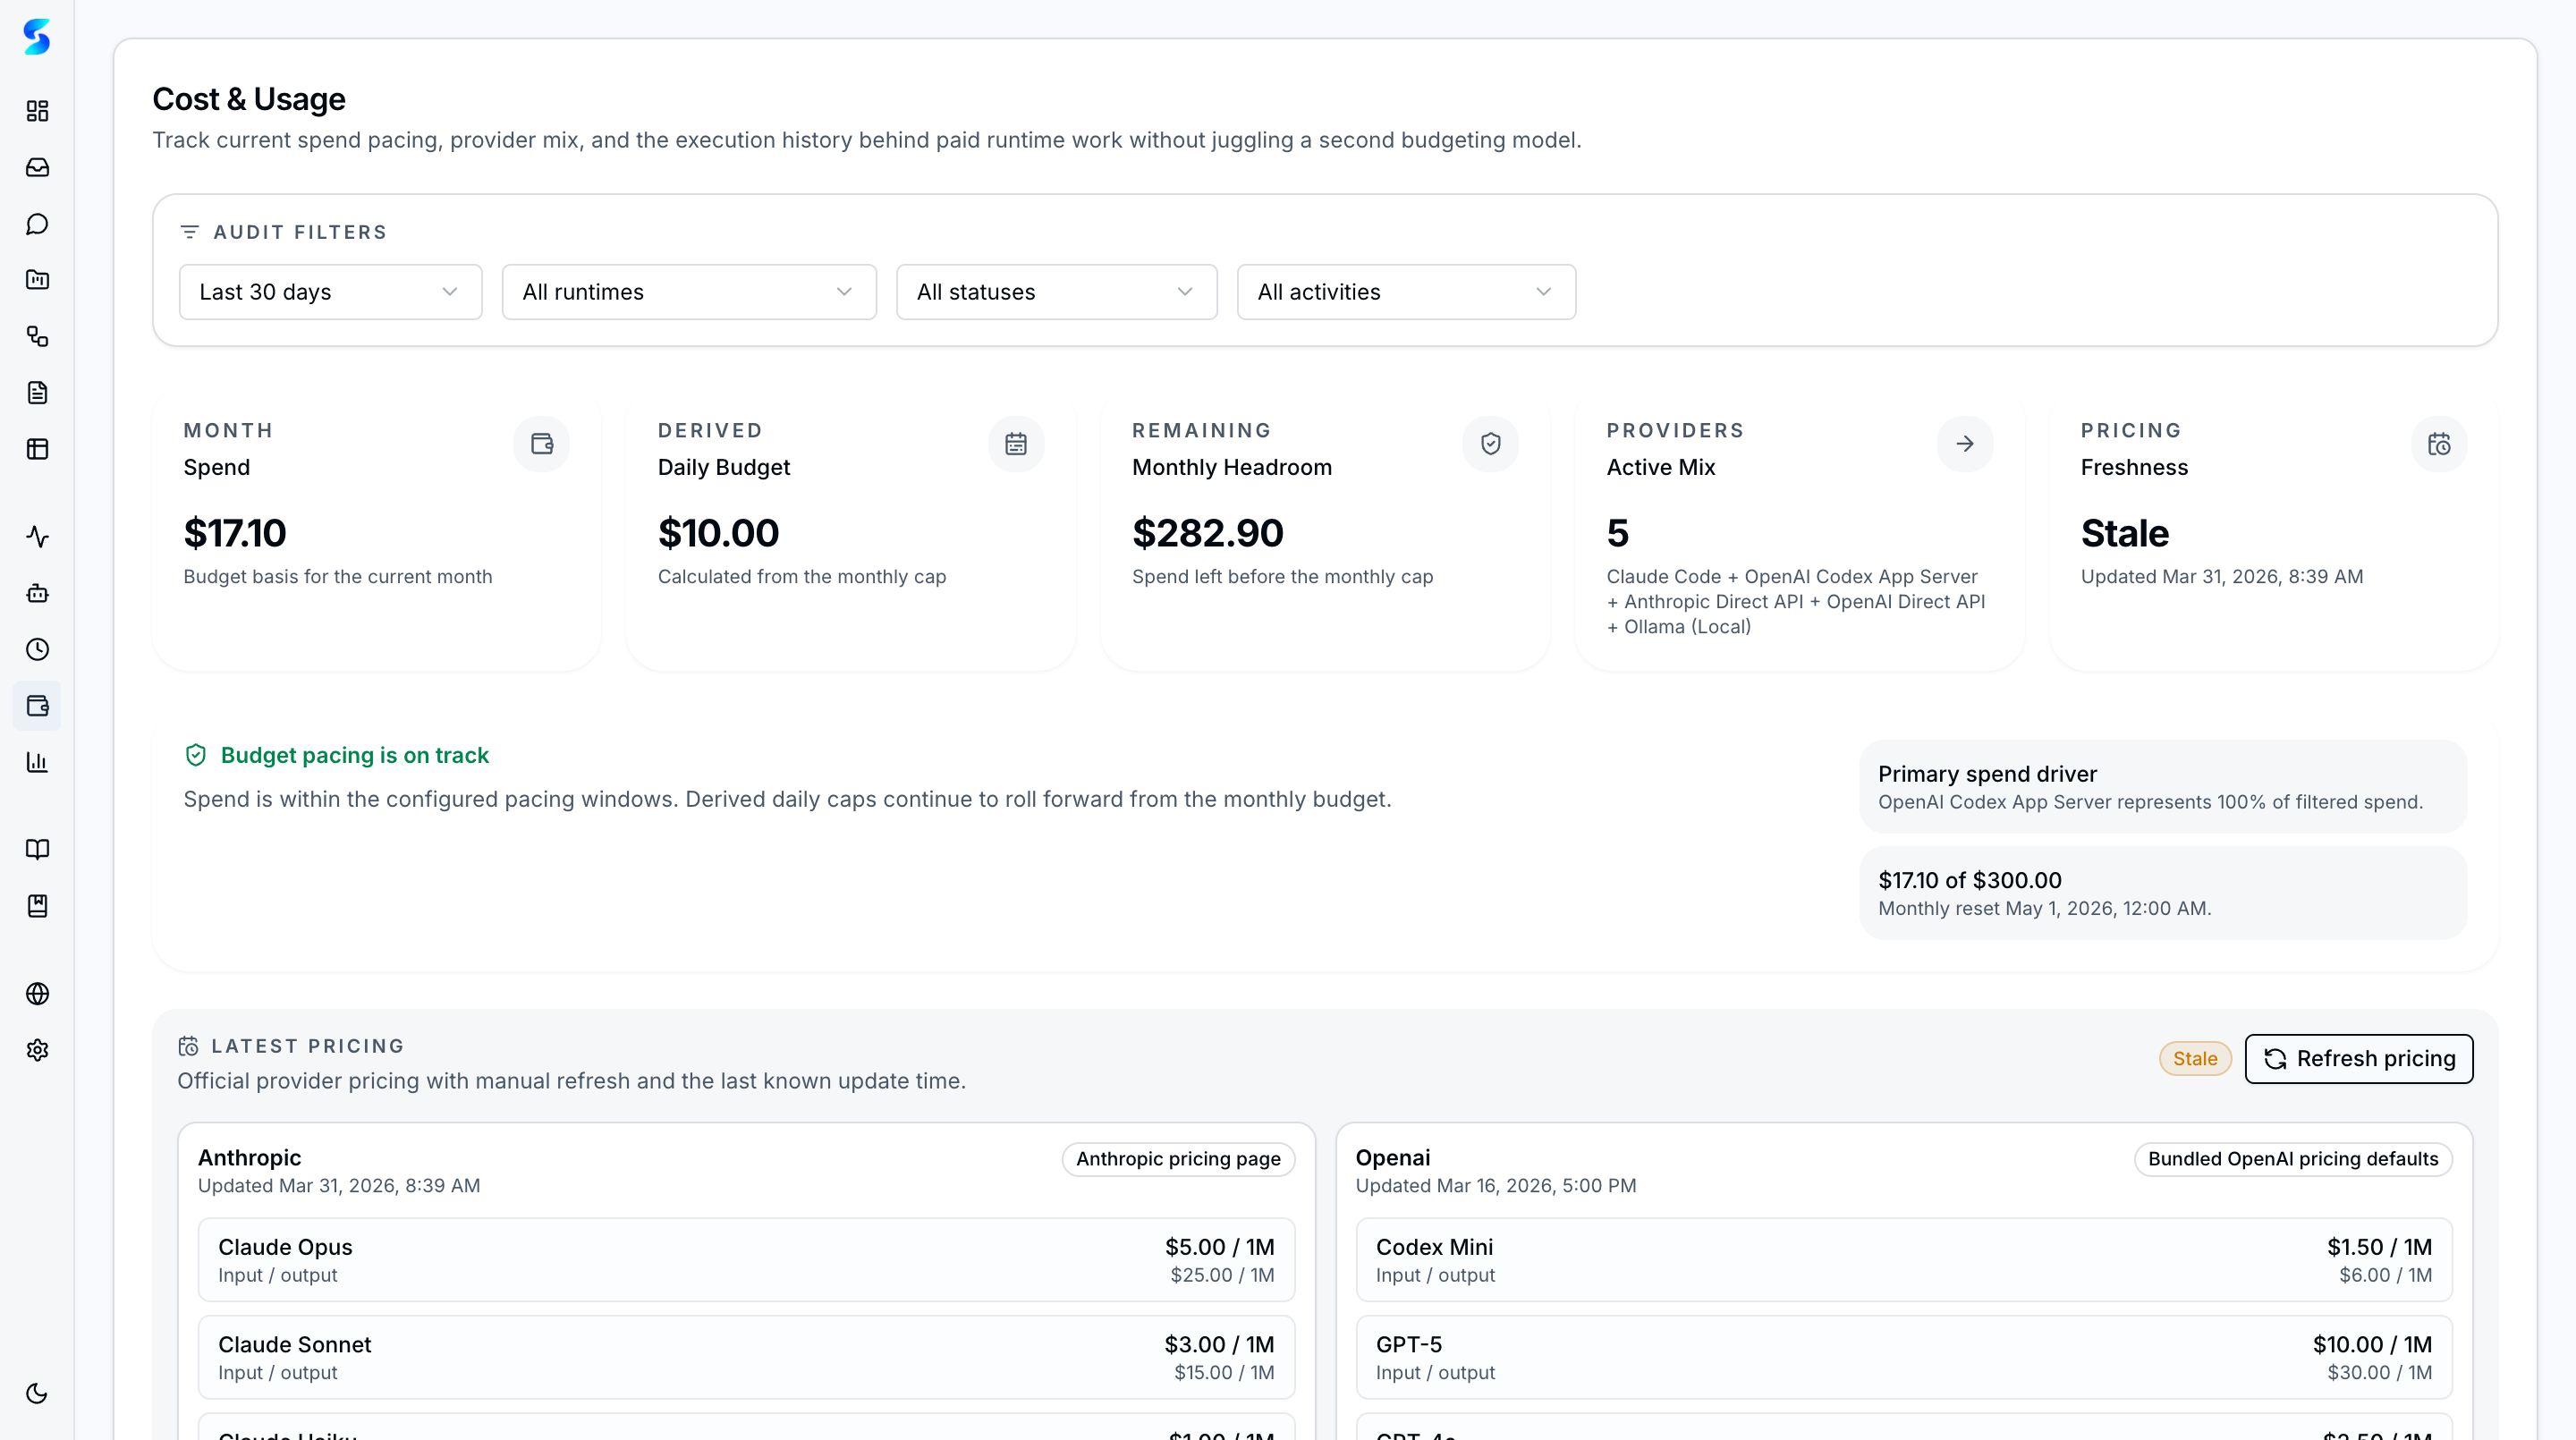
Track spend across providers and monitor token consumption with the cost and usage dashboard. The usage metering ledger records every token used by task, project, and provider, while budget guardrails enforce configurable spend caps to prevent runaway costs. Visual meters give you an at-a-glance view of current spend versus your configured budget. Tasks executed via Ollama (local models) are tracked at $0.
Screenshots
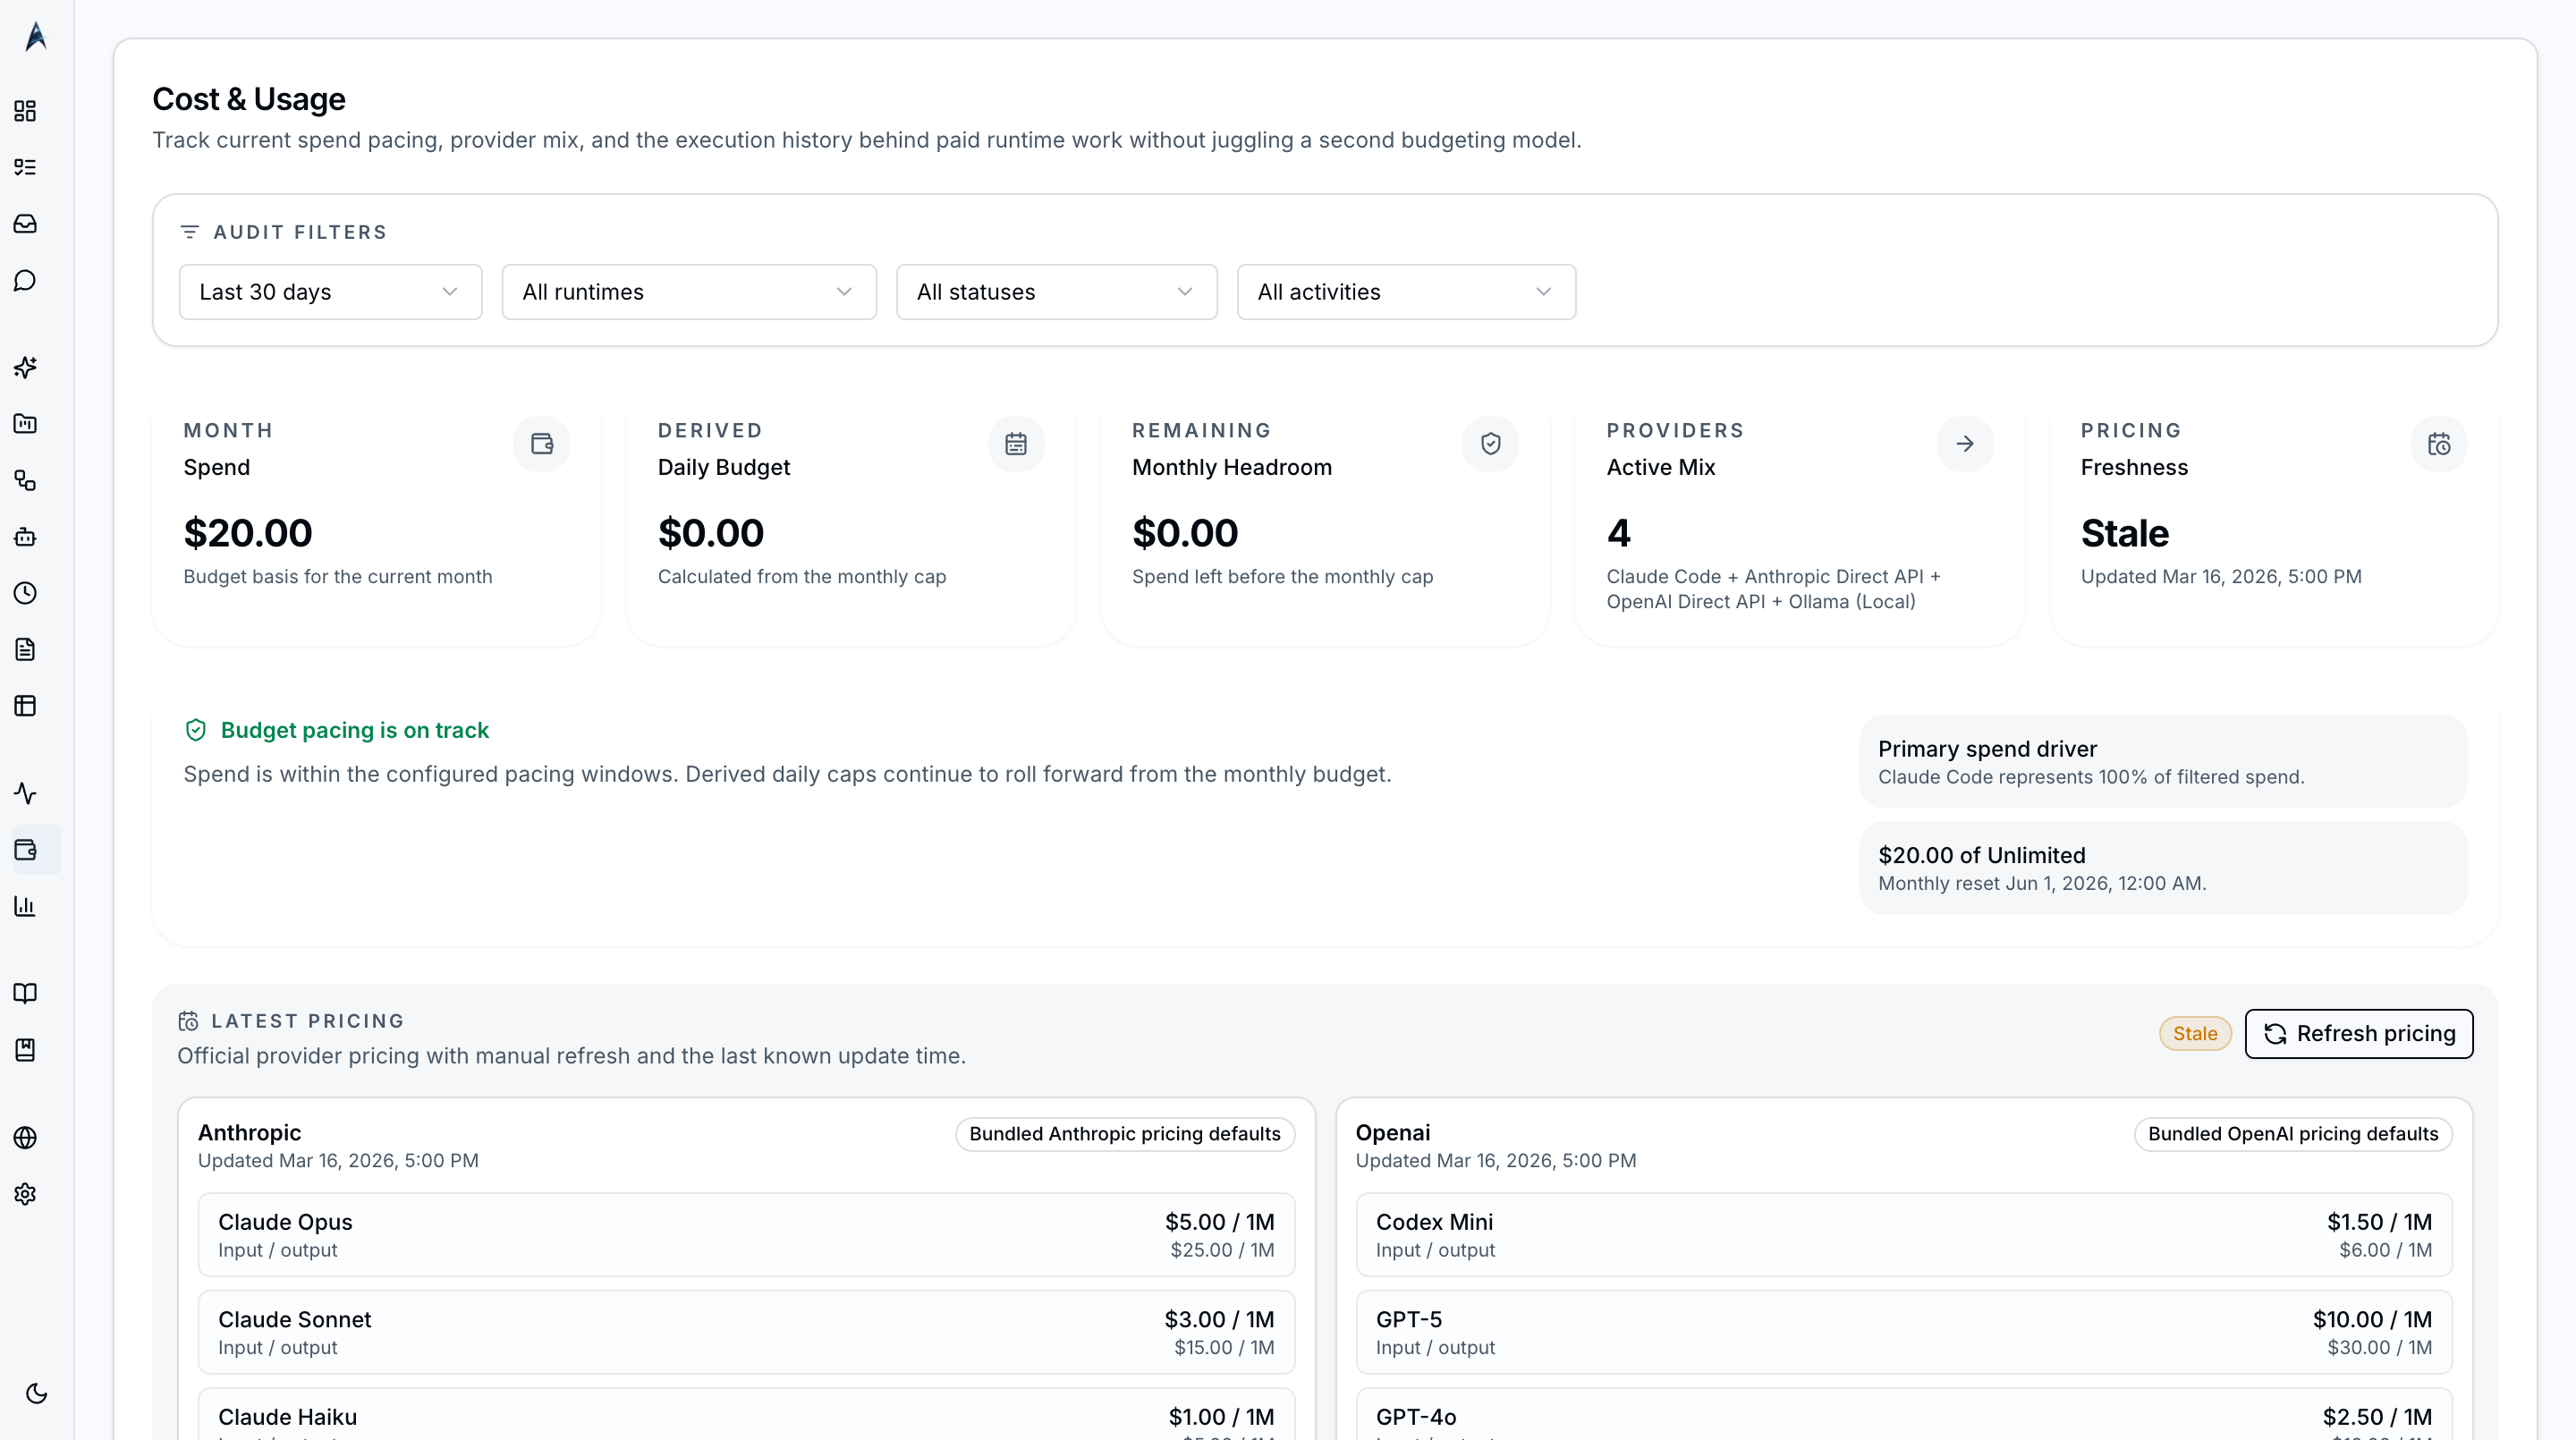 The cost and usage dashboard showing spend metrics, provider breakdown, and budget pacing indicators.
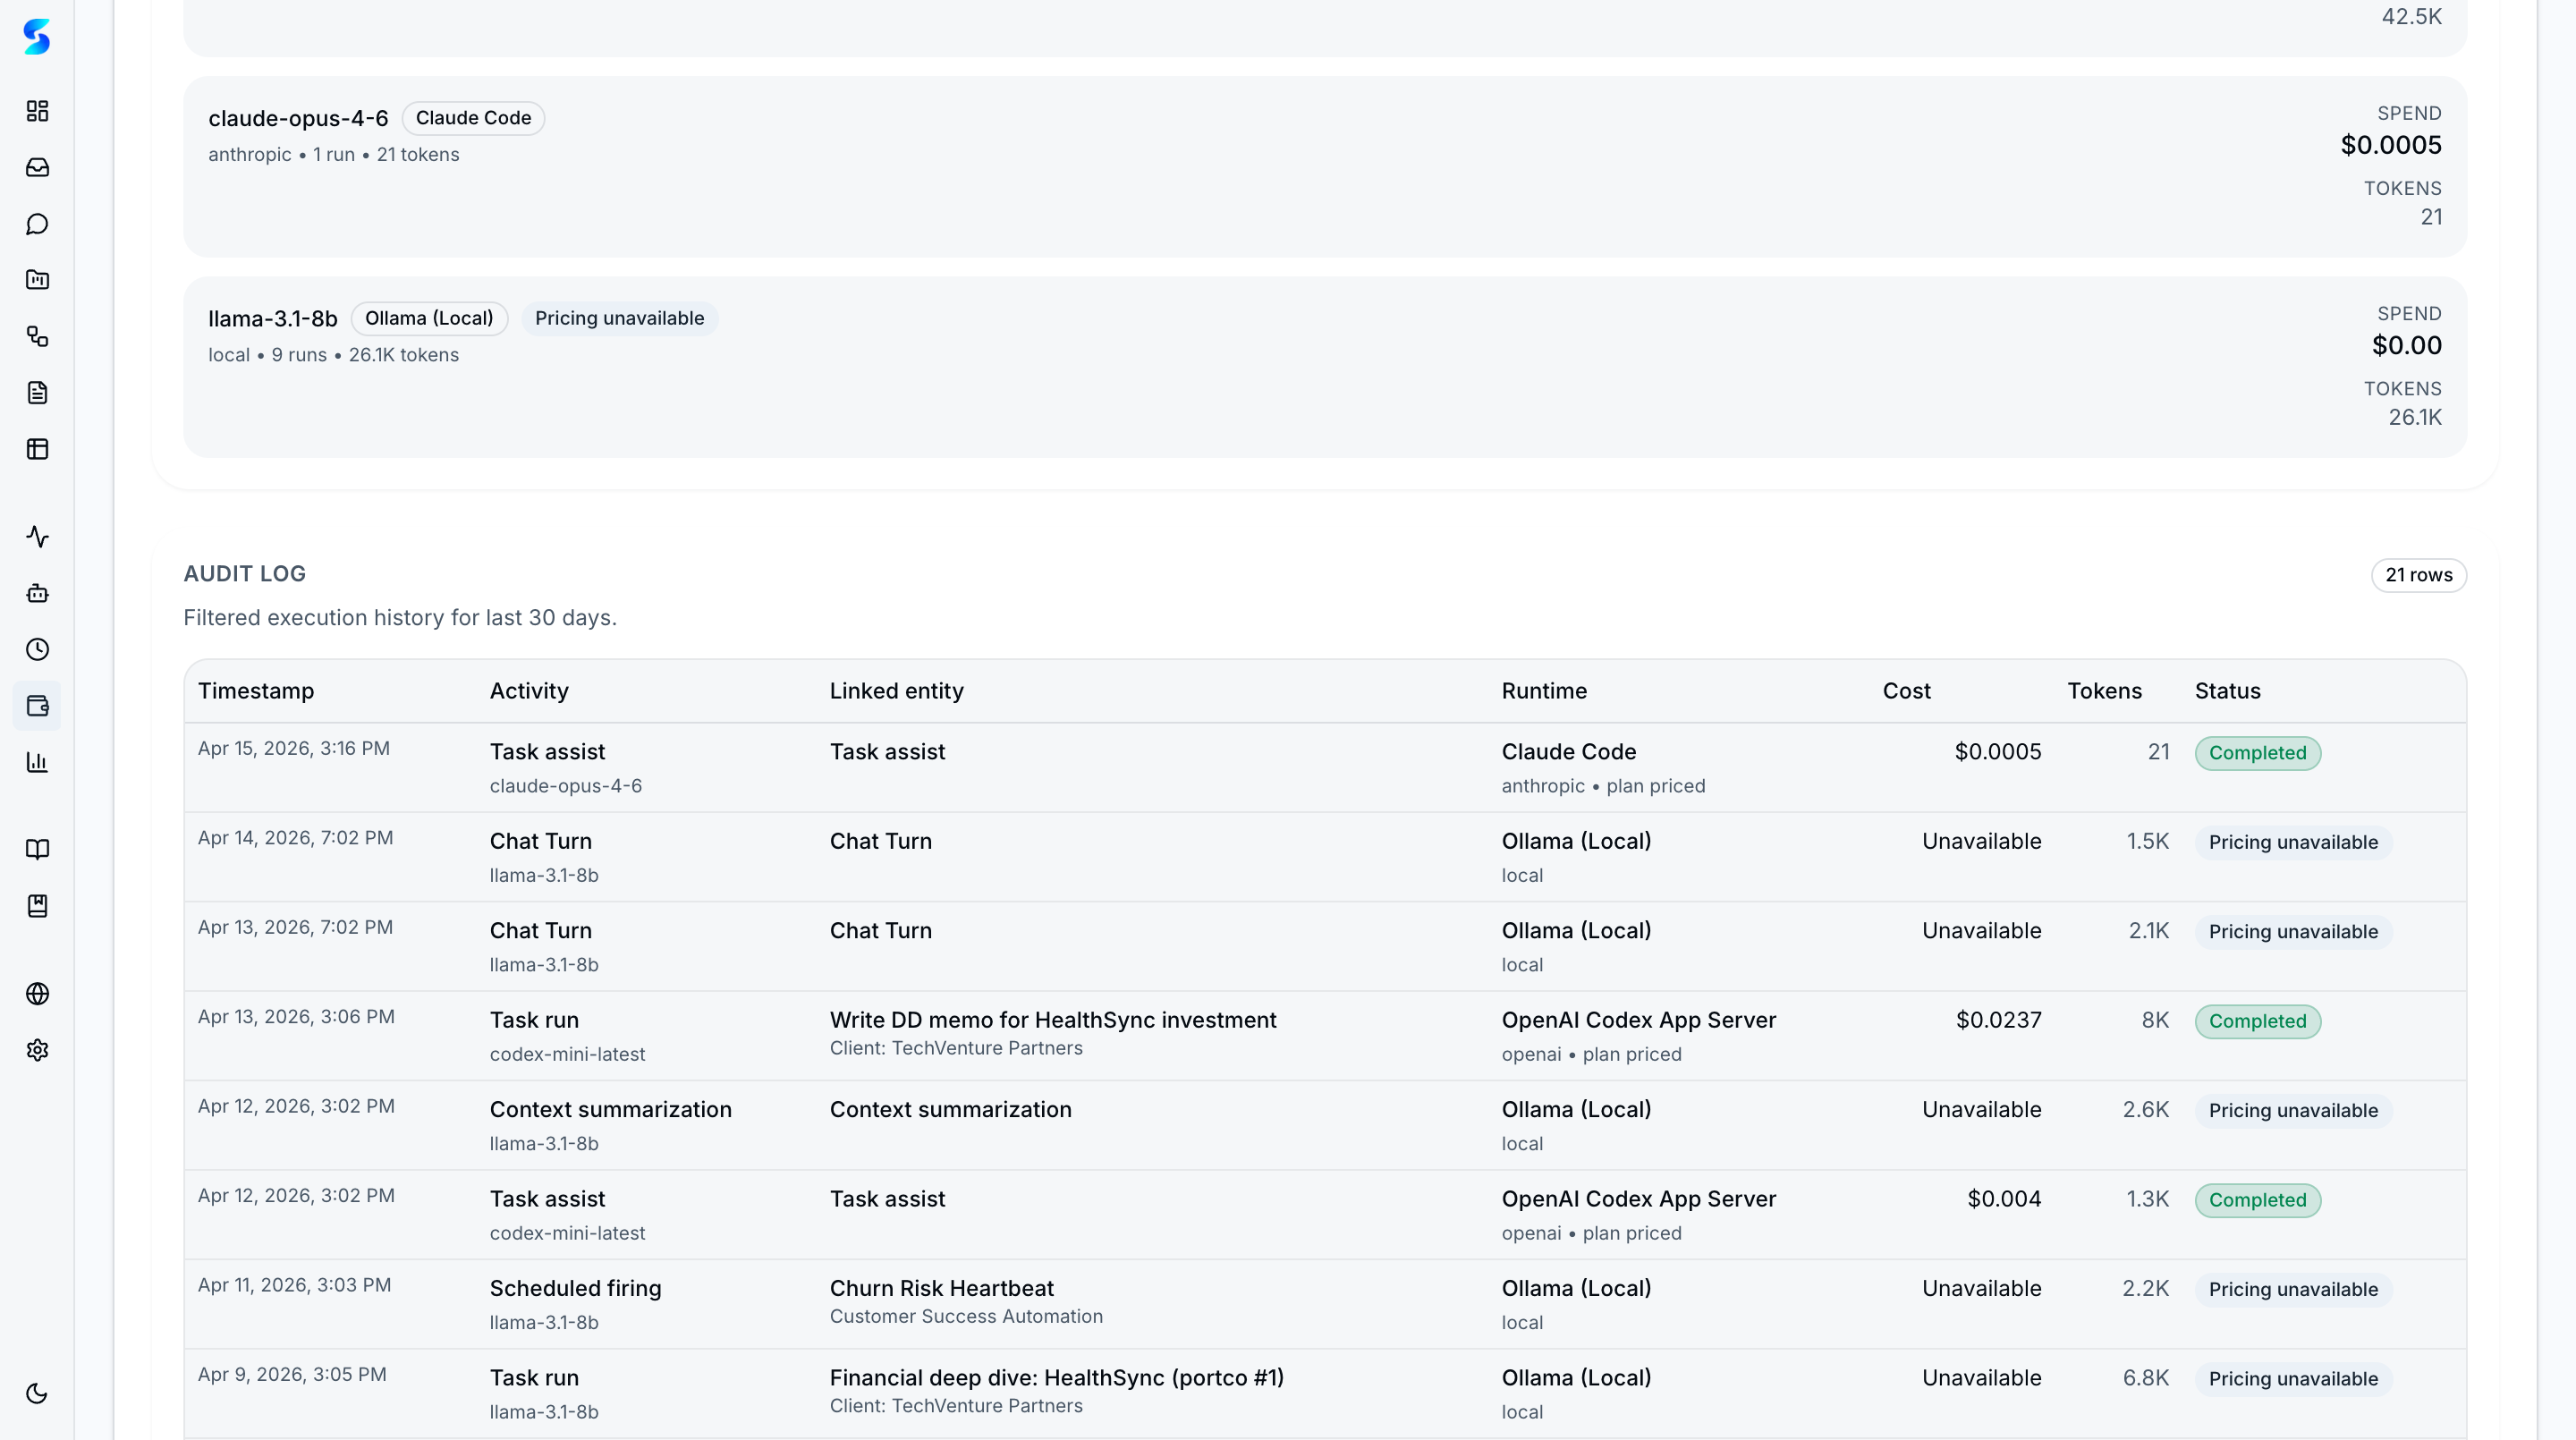 Detailed usage table and cost trends below the summary cards.
Key Features
Spend Dashboard
The cost dashboard provides an overview of total spend across all provider runtimes. Key metrics include total spend to date, current period spend, and trend indicators showing whether costs are increasing or decreasing relative to prior periods.
Usage Metering Ledger
Every agent execution records token consumption in the usage ledger. The ledger tracks input tokens, output tokens, and total tokens broken down by individual task, parent project, and provider runtime. This granular data enables precise cost attribution and optimization.
Provider Breakdown
Spend is segmented by provider runtime, showing separate cost totals for Claude (Agent SDK and Direct API), Codex (App Server and Direct API), and Ollama ($0 local). The breakdown helps you understand which provider is driving costs and make informed decisions about runtime selection.
Budget Guardrails
Configure spend caps to prevent unexpected cost overruns. Set an overall budget limit and monthly allocation splits. When spend approaches the cap, alerts notify you before the limit is reached. Once the cap is hit, guardrails pause new executions to prevent further charges.
Visual Budget Meters
Progress bars and visual meters display current spend relative to your configured budget. Color-coded indicators shift from green to yellow to red as spend approaches the cap, providing immediate visual feedback on budget health.
How To
Review Current Spend
- Navigate to
/costsfrom the sidebar under the Observe group. - View the total spend summary at the top of the dashboard.
- Check the provider breakdown to see spend by runtime.
- Review the visual meters for budget pacing.
Set a Budget Cap
- Navigate to
/settingsand open the Budget section. - Enter an overall spend cap amount.
- Configure the monthly split to distribute the budget across the billing period.
- Save the settings. The budget meters on the cost dashboard will reflect the new cap.
Investigate High Spend
- Open the cost dashboard at
/costs. - Identify which provider or project is contributing the most spend.
- Scroll down to the usage breakdown table for granular task-level data.
- Consider switching to Ollama (local models) for tasks that do not require cloud-level capability, or adjust task prompts to reduce token usage.
Related
Related Features
- Monitoring — Follow live execution before it settles into the usage ledger
- Settings — Configure budget guardrails and provider authentication
- Agent Integration — Understand the dual-runtime layer behind the ledger