Case Study: Building a Domain Application in One Day
A Solo Founder’s Wealth Manager Build on ainative-business — From Zero to Prediction Market Integration in 11 Commits
Manav Sehgal · April 2026 · Applied Research
Abstract
This paper presents a detailed case study of building a full-featured wealth management application — including prediction market integration, divergence detection, scenario modeling, and conviction synthesis — in a single day using ainative-business’s AI agent infrastructure. Drawing from verifiable git history (11 commits, 7,435 lines of code, 44 files), we demonstrate that solo founders can build sophisticated domain applications at speeds previously requiring engineering teams, when the underlying infrastructure handles orchestration, governance, scheduling, and data management. The build also produced a significant platform improvement (schedule collision prevention), illustrating the self-reinforcing feedback loop between domain applications and the platforms they run on. We position this case study as evidence for the emerging “AI-native builder” pattern — individual knowledge workers who shape general-purpose AI infrastructure around their specific domain expertise.
Table of Contents
- The Solo Builder Thesis
- Background:
ainative-businessas Application Infrastructure - The Wealth Manager Build: Timeline and Architecture
- Prediction Market Integration: A Case for Composable Intelligence
- Platform Feedback Loop: Schedule Collision Prevention
- Quantitative Analysis: Build Efficiency Metrics
- Implications for the Agentic Economy
- Limitations and Future Work
1. The Solo Builder Thesis
The Macro Trend
The global AI agent market is projected to grow from $7.63B (2025) to $52.62B (2030) at a 46.3% CAGR (Grand View Research). Simultaneously, solo-founded startups have increased from 23.7% to 36.3% of all new ventures between 2019 and H1 2025 (Carta). These two trends are converging: AI infrastructure is becoming powerful enough that individual builders can produce systems that previously required teams.
| Metric | Value | Source |
|---|---|---|
| Solo-founded startups (H1 2025) | 36.3% of all new ventures | Carta |
| US solopreneurs | 41.8 million | US Census |
| AI agent market CAGR (2025-2030) | 46.3% | Grand View Research |
| One-person unicorn probability (2026) | 70-80% | Dario Amodei |
| Small businesses using AI tools | 60%+ | Multiple sources |
Sam Altman has expressed confidence in one-person billion-dollar companies enabled by AI agents. Dario Amodei estimates 70-80% odds of this occurring in 2026. The evidence is accumulating: Base44 (solo founder, $3.5M ARR, acquired by Wix for $80M in six months), HeadshotPro ($3.6M ARR, solo operation), and a growing cohort of AI-augmented solo operators building at scales that were previously impossible.
The Infrastructure Gap
But there is a gap between “AI can help you write code” and “AI can help you run a business function.” The former requires a chatbot. The latter requires infrastructure: data persistence, workflow orchestration, scheduling, governance, multi-model routing, and domain-specific agent profiles. Most solo founders attempting AI-powered operations report using 8–15 disconnected tools (community analysis), and 73% fail within 90 days.
The thesis of this paper is that the gap is closing — not through better chatbots, but through platforms that provide the full operational stack, allowing builders to focus exclusively on domain logic. We present a single, verifiable case study as evidence.
Why a Case Study Matters
Industry research on AI agent productivity typically relies on surveys, projections, and aggregated metrics. We take a different approach: a single build, fully documented in version control, where every claim is traceable to a specific commit, diff stat, and timestamp. The advantage is precision. The limitation is generalizability. We address the limitation in §8.
2. Background: ainative-business as Application Infrastructure
Platform Architecture
The ainative-business platform is a local-first AI agent workspace built on Next.js 16, React 19, and SQLite (WAL mode). It provides:
- 46+ database tables for structured data, documents, workflows, schedules, and agent logs
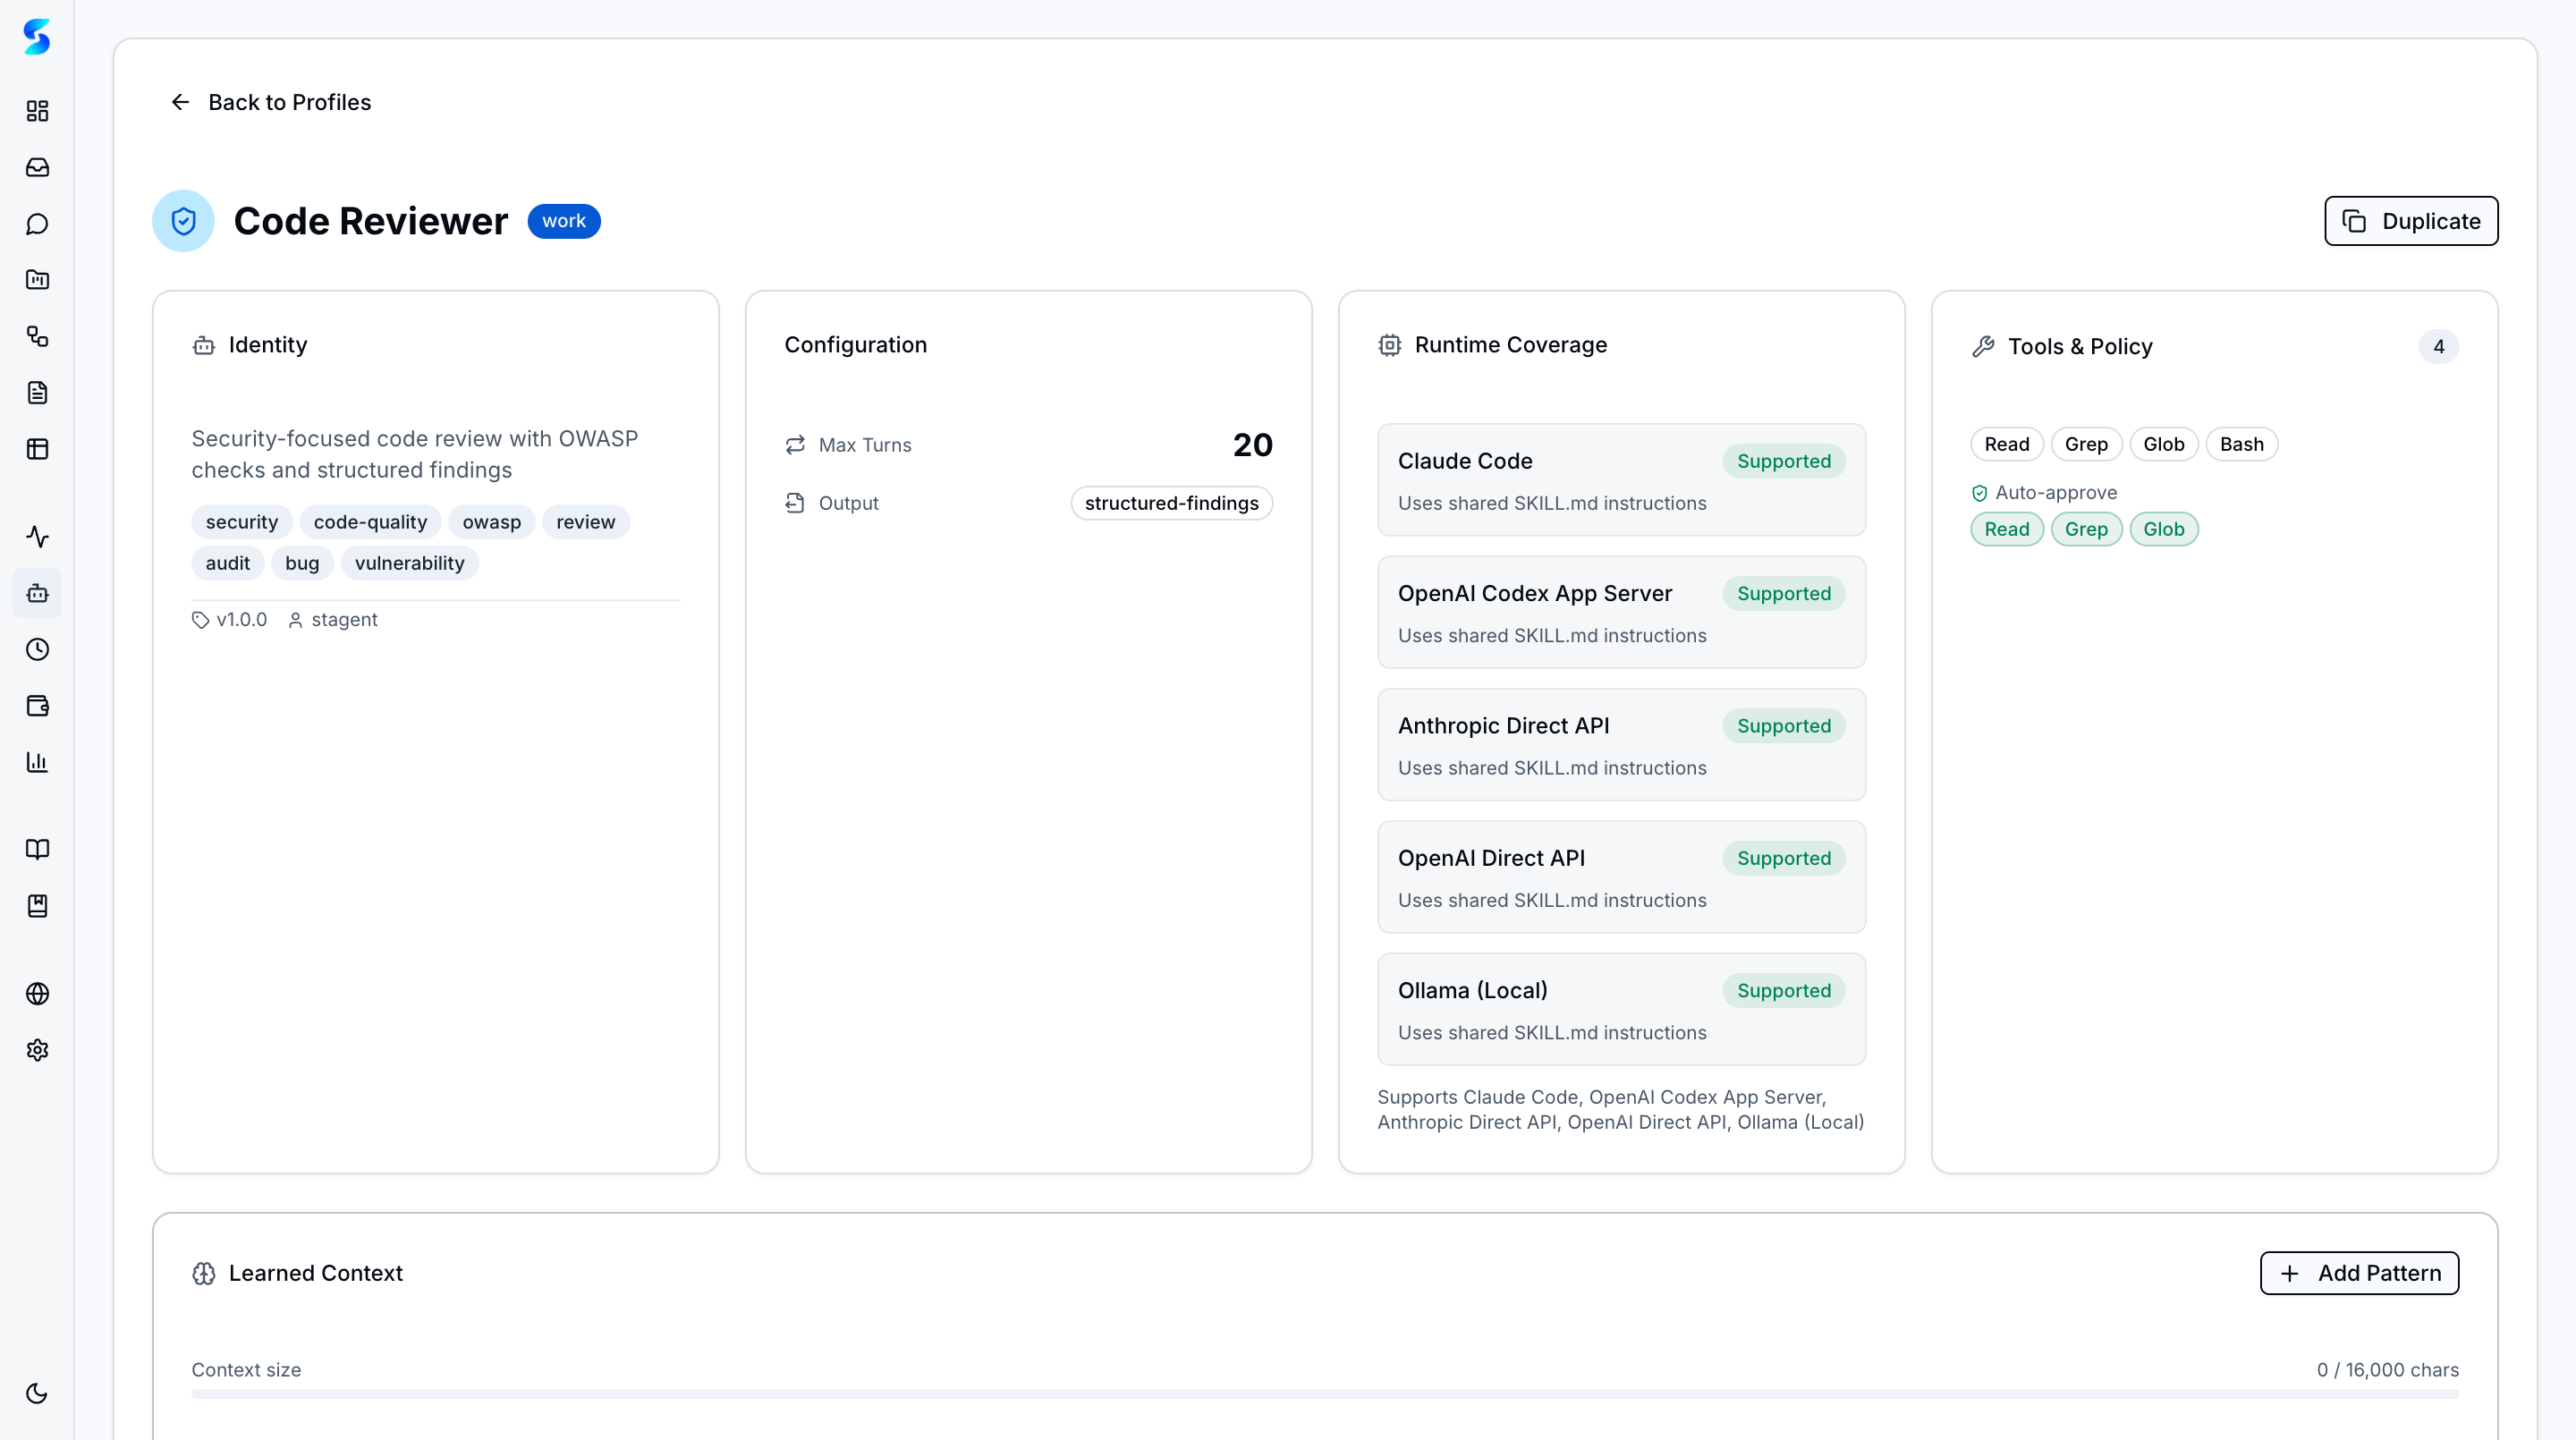
- 56+ specialist agent profiles with configurable tool permissions and behavioral constraints
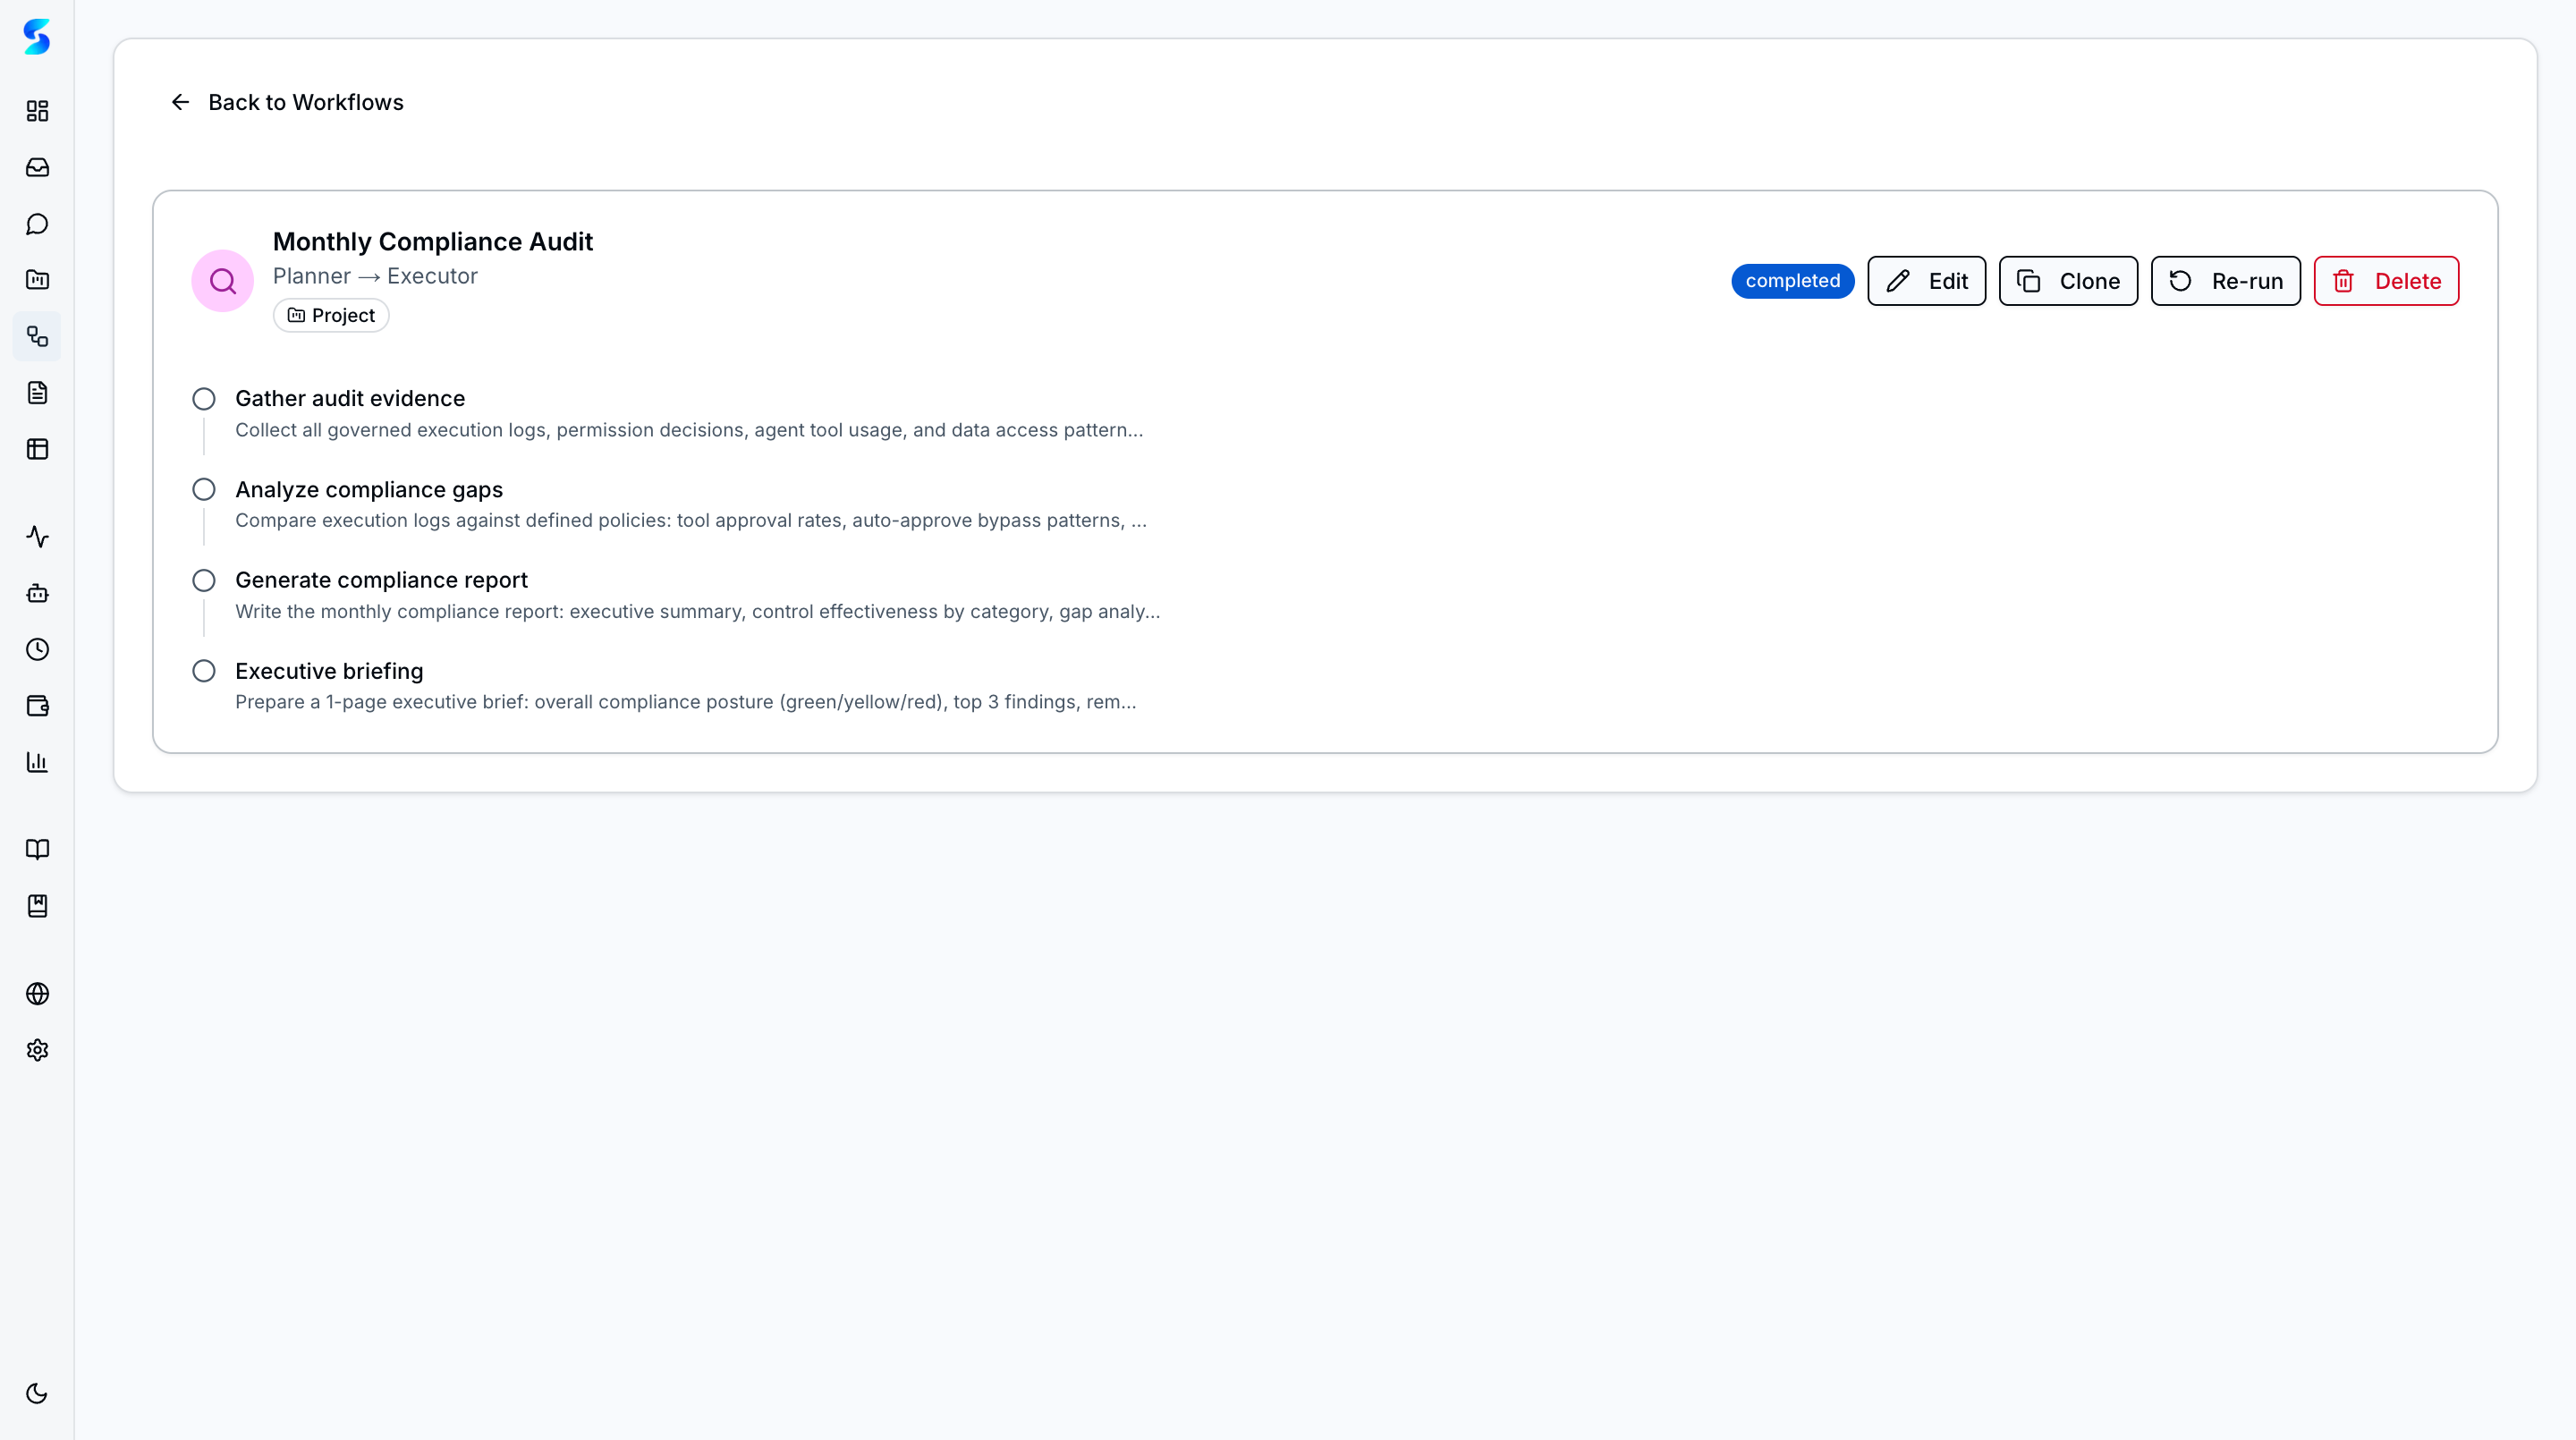
- 37 workflow patterns including sequence, planner-executor, checkpoint, parallel, loop, and swarm
- 6 AI runtimes (Claude Code, Anthropic Direct, OpenAI Direct, OpenAI Codex, Ollama, direct APIs)
- Heartbeat scheduling with natural-language interval configuration
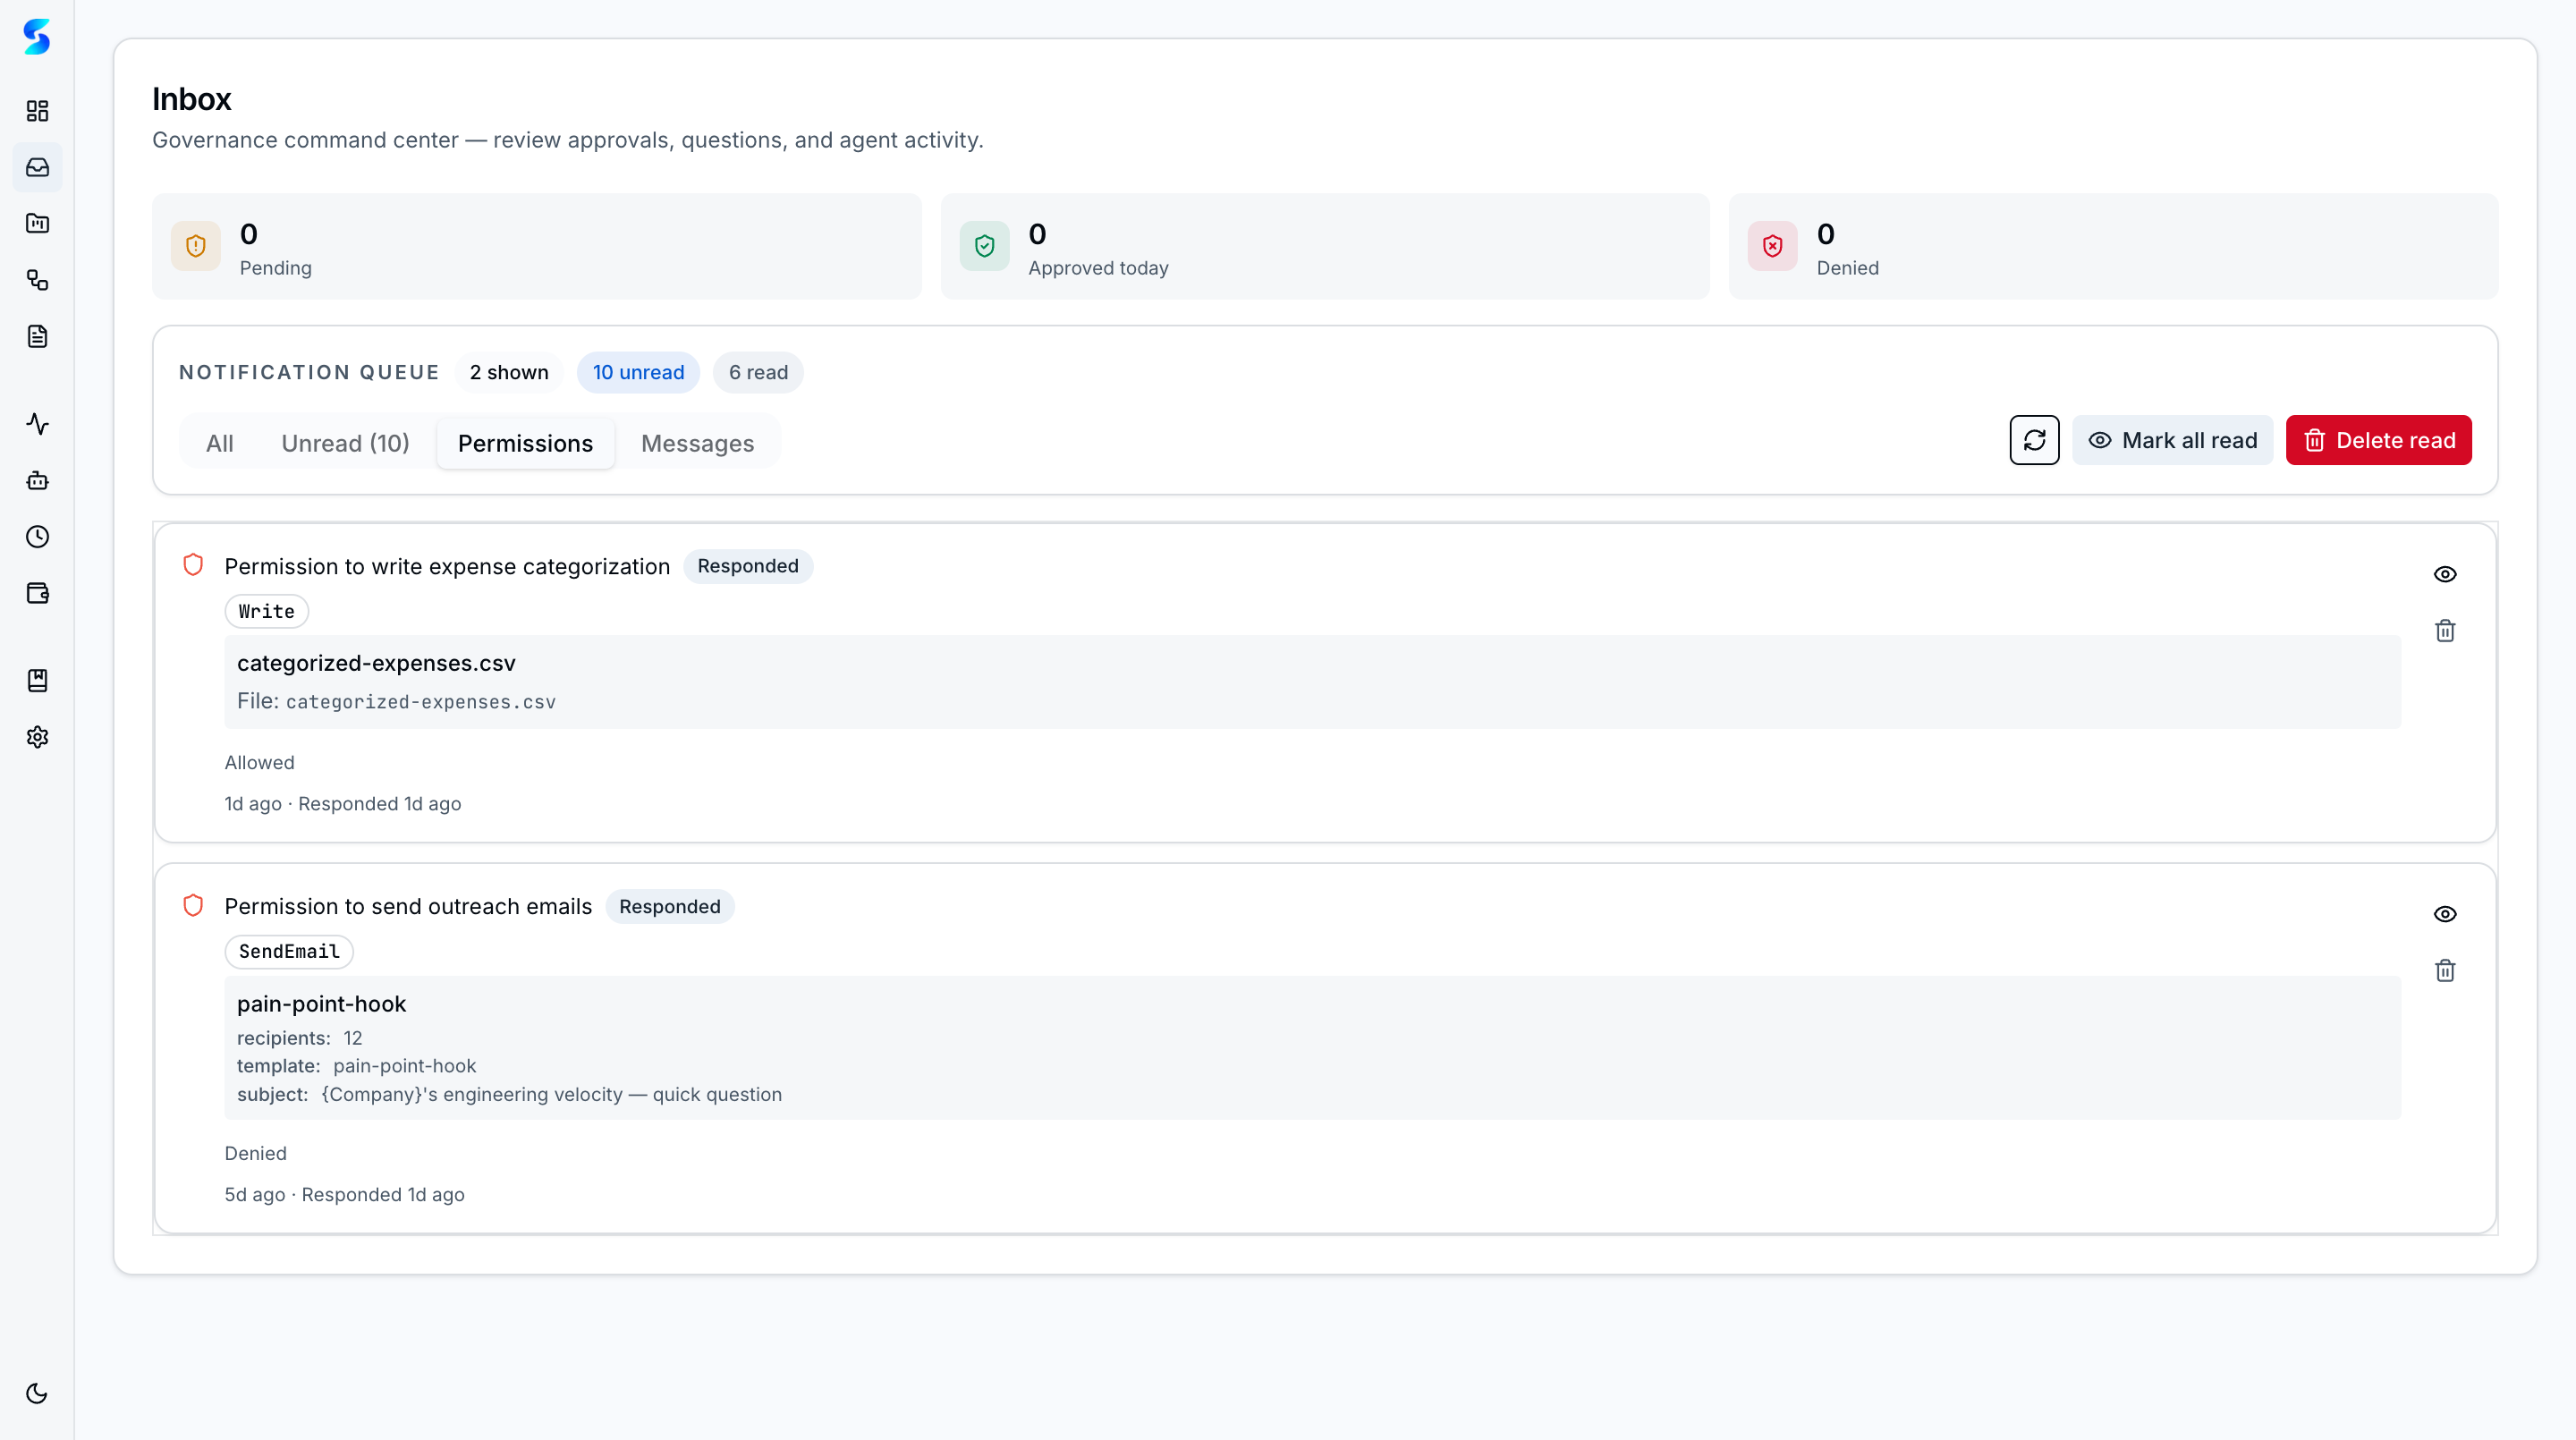
- Governance gates with 5-step approval flow and risk-tiered tool classification
The Composability Principle
The critical architectural property for this case study is composability. ainative-business’s components — tables, workflows, schedules, profiles, documents — are designed as orthogonal primitives that combine without special integration. A workflow can read from any table, write to any document, fire on any schedule, and use any agent profile. This means a domain application does not require new infrastructure. It requires new configurations of existing infrastructure.
The Self-Building Property
The ainative-business platform uses its own capabilities to produce its documentation, generate its book chapters, and monitor its codebase for drift. This “self-building” property — detailed in Chapter 11 of the AI Native Business book — establishes that the platform is not merely a product but a dependency for its own development team. The wealth manager build extends this property: the platform’s creator used the platform to build a domain application, discovering and fixing platform issues in the process.
3. The Wealth Manager Build: Timeline and Architecture
Build Timeline
The entire build occurred on April 6, 2026, on a dedicated git branch. The commit log provides a minute-resolution narrative:
| Phase | Commit | Description | Files | Lines |
|---|---|---|---|---|
| Foundation | #1 | Wealth Manager app (Phase 1–4): data layer, 7 pages, 7 components | 17 | +2,181 |
| Polish | #2 | Redesign dashboard bento grid for denser layout | 7 | +443/-229 |
| Polish | #3 | Inline quick links into bento grid | 1 | +13/-17 |
| Specification | #4 | Screengrabs + prediction-markets feature spec | 8 | +721 |
| Feature B+C | #5 | Macro Signals dashboard + prediction market integration | 4 | +527 |
| Feature D | #6 | Prediction-enhanced Rebalance Analyzer | 4 | +599 |
| Feature E | #7 | News/prediction divergence detection | 6 | +777 |
| Feature F | #8 | Scenario Modeler with market-priced probabilities | 4 | +839 |
| Fix | #9 | Navigation links + client-side helper fix | 3 | +42 |
| Synthesis | #10 | Daily Conviction Brief — CIO morning note with trade sizing | 4 | +894 |
| Total | 11 commits | 44 | +7,435 |
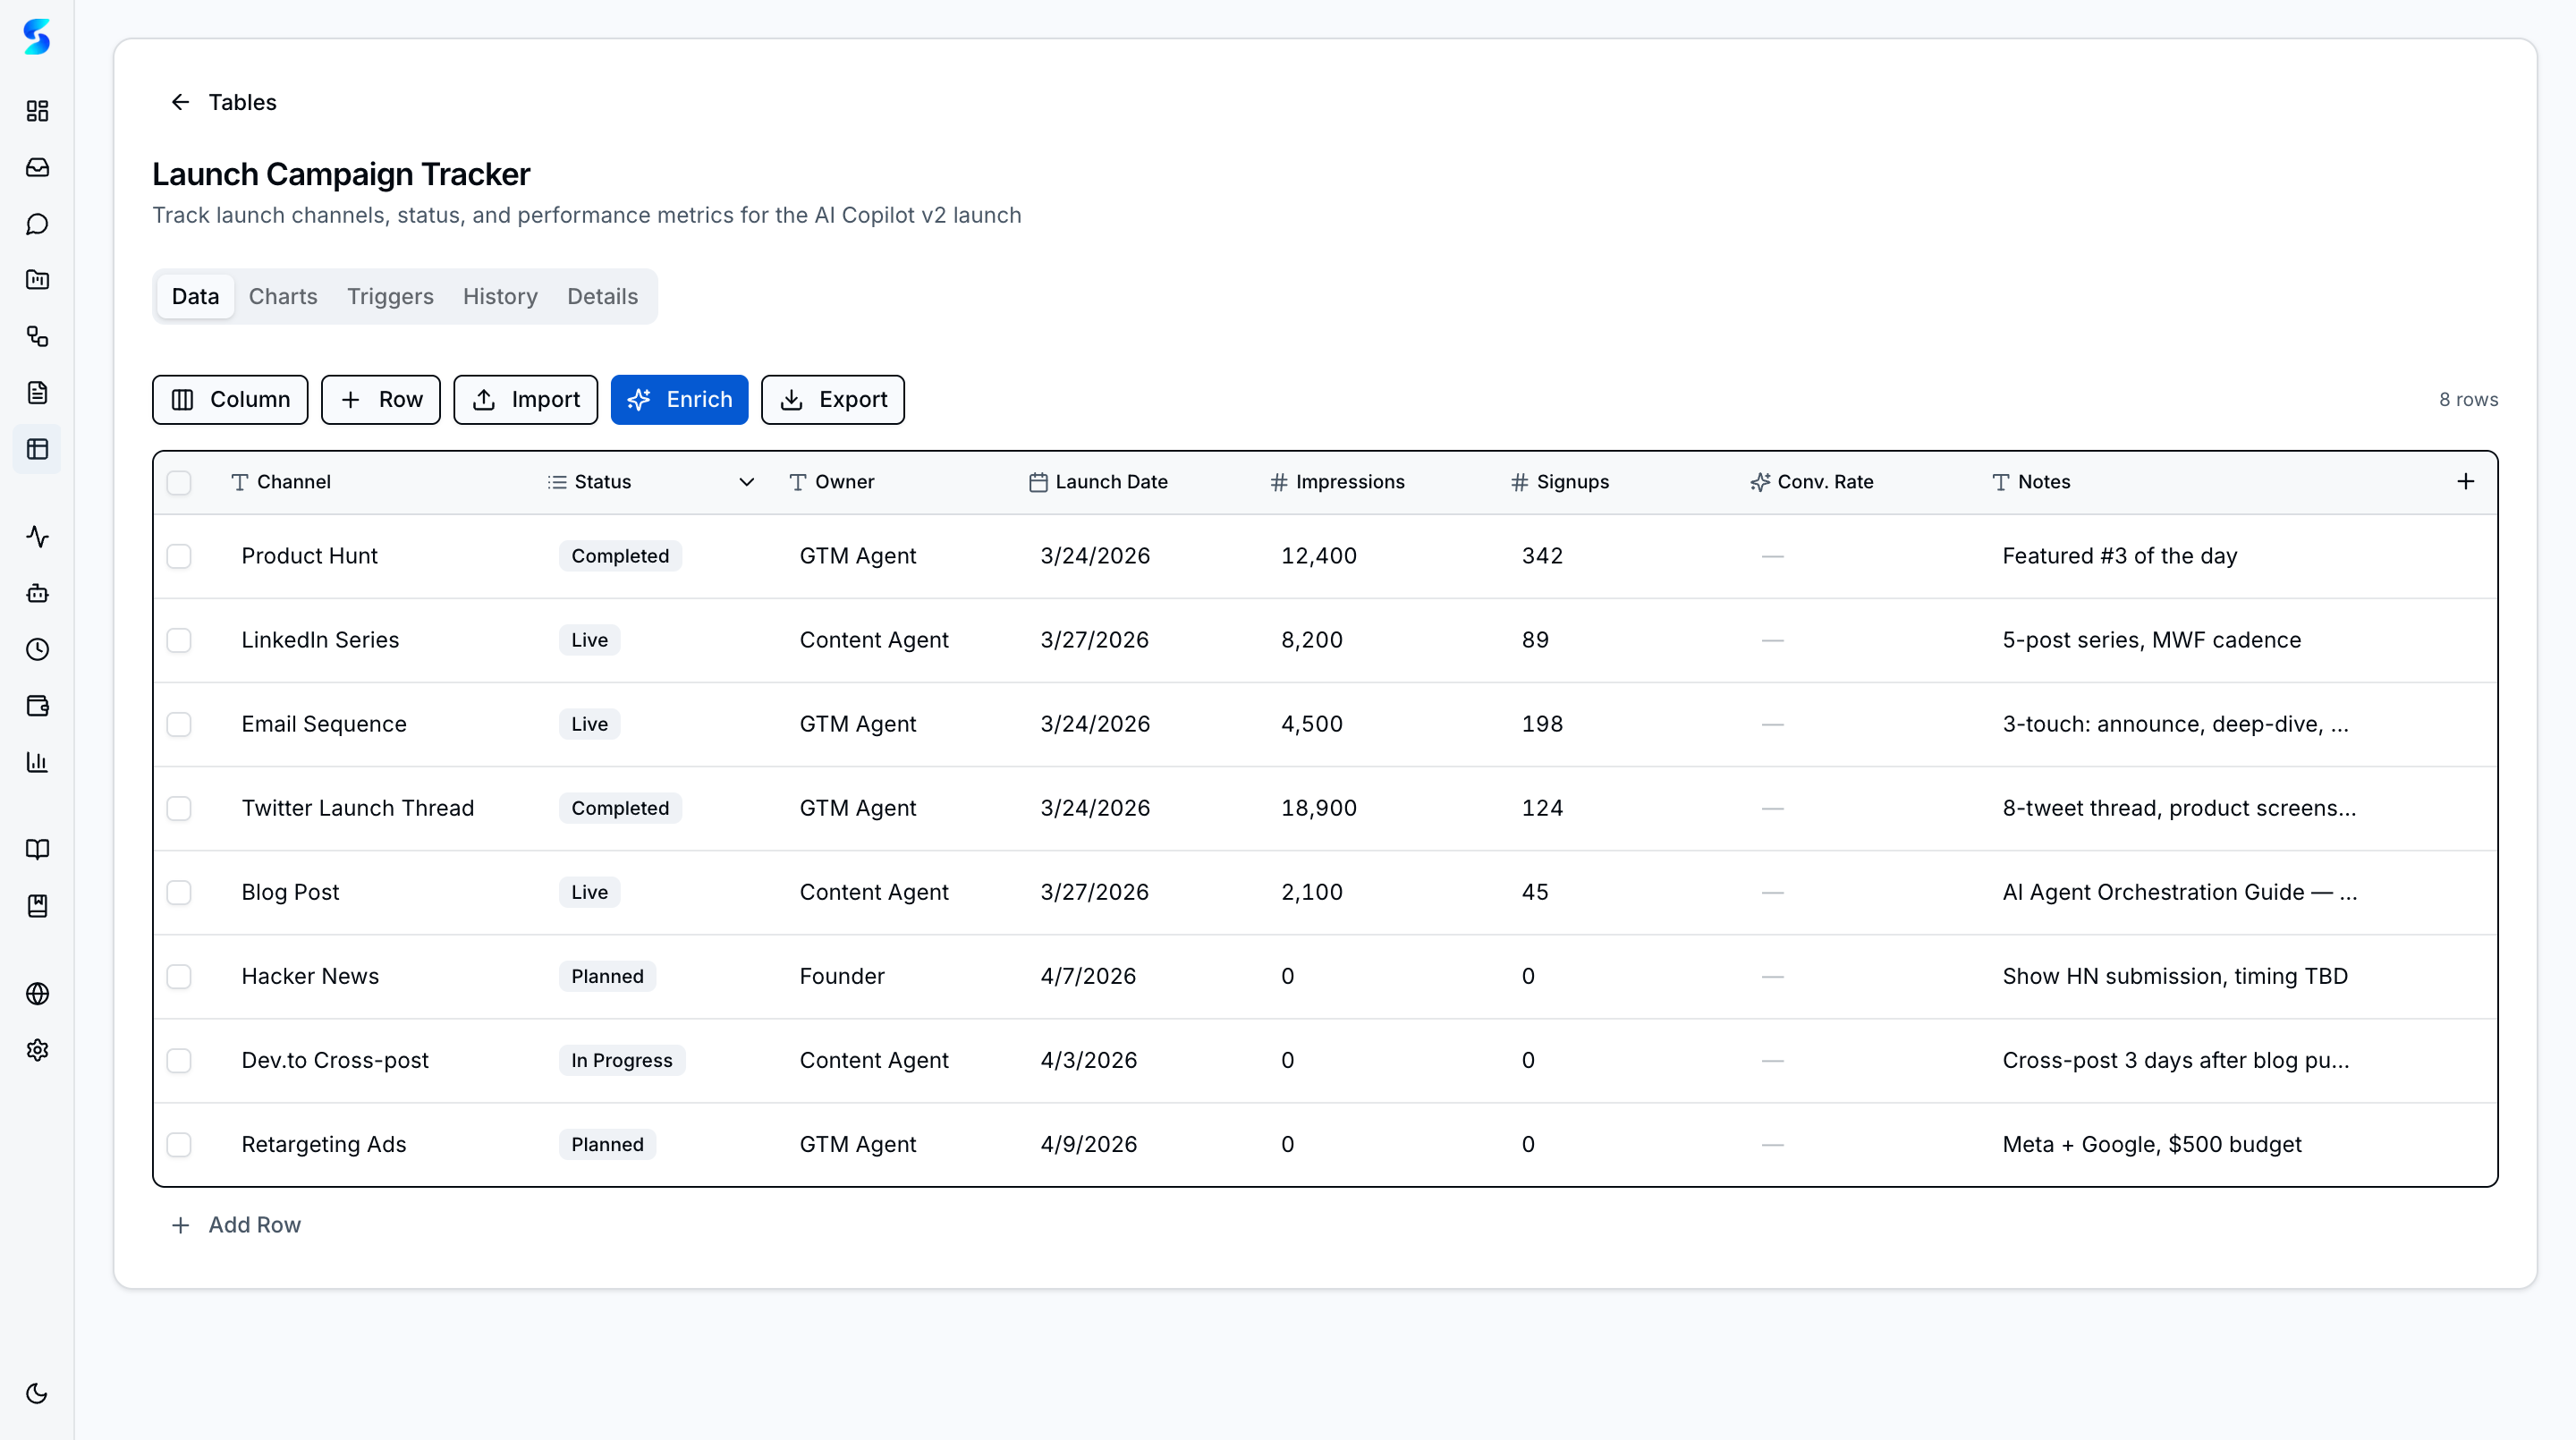
What Was Built
The wealth manager application comprises:
10 pages (/wealth-manager/*): dashboard, positions, watchlist, alerts, transactions, tax center, reports, macro signals, rebalance, scenarios, conviction
12 UI components: PortfolioSummaryCards, AllocationChart, AlertsPanel, PositionsTable, WatchlistTable, ReportsFeed, TaxCenterPanel, MacroSignalCards, RebalanceAnalyzer, ScenarioModeler, DivergenceAlerts, DailyConvictionBrief
1,755-line data layer (data.ts): 18 TypeScript interfaces, 30+ typed accessor and computation functions, covering positions, transactions, alerts, wash sales, portfolio snapshots, prediction markets, divergence detection, drift computation, conviction scoring, and trade sizing
3 Polymarket API integrations: Gamma API (market discovery), CLOB API (real-time prices), Data API (trade feeds)
Architectural Decision: No New Infrastructure
The most significant architectural decision was to build entirely on ainative-business’s existing data model. Portfolio positions, prediction markets, alerts, and transactions are all stored in userTables and userTableRows — the same structured data tables used by any ainative-business project.
This decision had three consequences:
- Zero database migration. No new tables were created at the SQLite level. All domain entities are rows in existing tables.
- Full agent compatibility. Any
ainative-businessagent can read, write, and query wealth manager data using the same table tools (query_table, search_table, add_rows, update_row) available in every project. - Workflow reuse. The rebalance analyzer and scenario modeler are workflow definitions — not new workflow engines. They run on the existing workflow execution infrastructure.
4. Prediction Market Integration: A Case for Composable Intelligence
Why Prediction Markets
Polymarket’s public APIs provide real-money-backed probabilities on macro events. Unlike analyst forecasts or sentiment scores, prediction market prices represent actual capital at risk. A market reading “Fed rate cut: 68%” means traders have wagered enough money at that price to establish an equilibrium. This is an information-theoretic signal — prices aggregate distributed private information more efficiently than any single analyst or model.
For portfolio decisions, prediction markets provide:
| Signal Type | Traditional Source | Prediction Market Advantage |
|---|---|---|
| Rate cut probability | Fed funds futures, analyst consensus | Real-money-backed, continuously updated |
| Recession probability | Economic models, survey data | Aggregates diverse information sources |
| Sector-specific events | Industry analysis | Direct probability rather than directional sentiment |
| Geopolitical risk | Expert judgment | Quantified, comparable, and time-stamped |
The Six-Feature Architecture
The prediction market integration was designed as a layered feature set where each layer builds on the previous:
Layer A: Data Foundation (prediction_markets table, market curation)
    ↓
Layer B: Live Data (price monitor extension, 30-min refresh cycle)
    ↓
Layer C: Visualization (macro signals dashboard, signal cards, alerts)
    ↓
Layers D/E/F (independent, parallel):
  D: Rebalance Enhancement (prediction-weighted urgency model)
  E: Divergence Detection (news sentiment vs. prediction probability)
  F: Scenario Modeling (market-priced probability scenarios)
    ↓
Synthesis: Daily Conviction Brief (CIO morning note)
This architecture is itself a workflow pattern — the same planner-executor-with-parallel-branches pattern available in ainative-business’s workflow engine. The human’s development process mirrored the patterns the platform provides for agent execution.
The Divergence Detection Model
Feature E — news/prediction divergence detection — deserves particular attention because it demonstrates a form of composable intelligence: combining two independent data sources (news sentiment and prediction market prices) to produce a signal that neither source provides alone.
| Scenario | News Signal | Prediction Signal | Divergence Type | Action |
|---|---|---|---|---|
| Headlines bearish on NVDA, “NVDA >$150” probability rising | Negative | Bullish | Bullish divergence | Review for entry |
| Headlines bullish on energy, “Oil >$80” probability falling | Positive | Bearish | Bearish divergence | Review for exit |
| Headlines neutral on recession, recession probability spiking | Neutral | Risk-on | Risk signal | Increase defensive allocation |
| Headlines alarming on tariffs, tariff market probability stable | Negative | Flat | Noise filter | Ignore headlines |
The divergence score is computed as news_sentiment × probability_direction. A score of -1 indicates divergence (they disagree) — the highest-signal condition. This is a simple model, but its power comes from the data sources it connects, not from algorithmic sophistication.
The Conviction Engine
The Daily Conviction Brief synthesizes all signal sources into actionable output:
- Market regime classification — reads Polymarket probabilities across macro categories to determine risk-on/risk-off/rotation
- Per-position confidence scoring (0–100) — weighted composite of drift magnitude, prediction alignment, scenario impact, and divergence signals
- Action determination — BUY/SELL/HOLD based on confidence thresholds and regime context
- Trade sizing — dollar amounts and share counts derived from rebalance recommendations and confidence levels
- Rationale synthesis — per-position narrative explaining the recommendation
This is a synthesis layer — it produces no new data, only new intelligence by combining existing signals. The pattern is generalizable: any domain application that produces multiple independent signals benefits from a conviction/synthesis layer that reads all of them.
5. Platform Feedback Loop: Schedule Collision Prevention
The Discovery
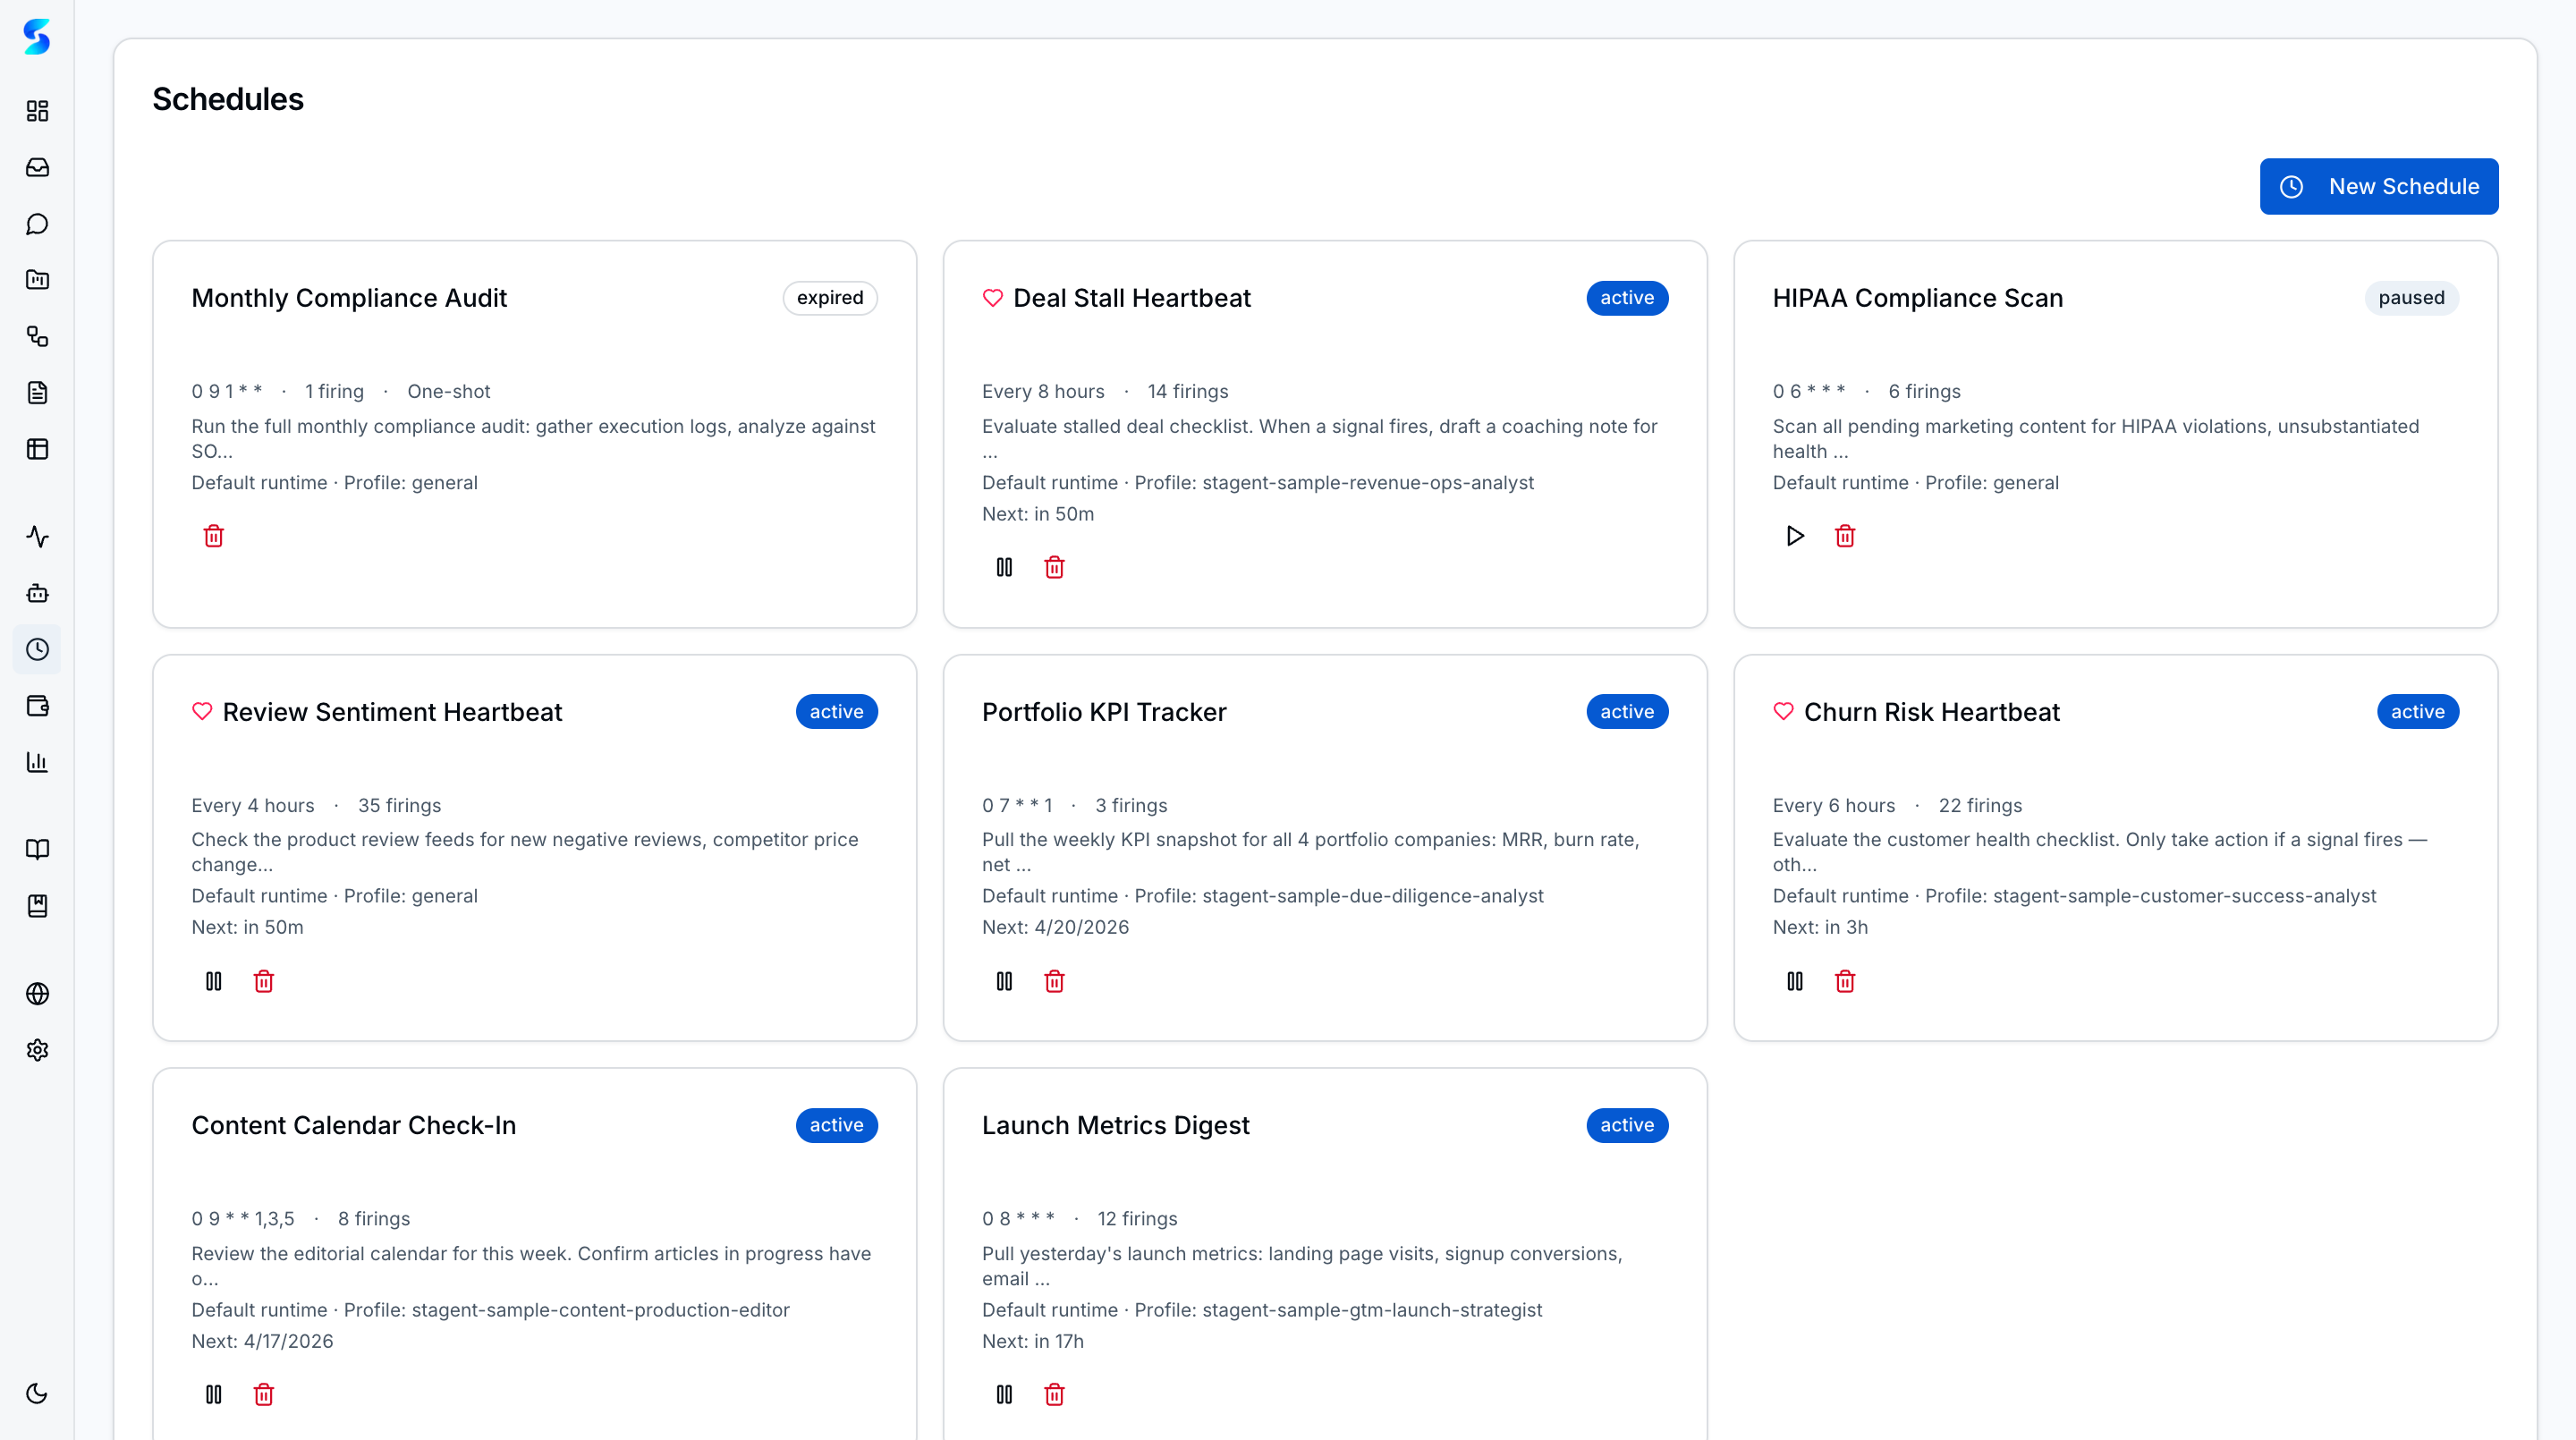
During development, the builder configured two schedules: a price monitor (every 30 minutes during market hours) and a news sentinel (every 2 hours). When both schedules fired at the same minute — which occurs at every even hour during market hours — queue starvation resulted. The second schedule’s task waited for the next 30-second poll cycle, potentially delaying execution by 30+ minutes.
This was not a testing-phase discovery. It was a production-use discovery: the builder noticed that their portfolio alerts were arriving late after the news sentinel had fired at the same time as the price monitor.
The Fix: Four Phases
The schedule collision prevention fix was substantial — 1,015 lines across 9 files, with 19 new tests — and comprised four phases:
| Phase | Implementation | Benefit |
|---|---|---|
| 1. Queue drain | drainQueue() walks queued task list after every firing completes, protected by module-level mutex | Collided schedules no longer wait for next poll cycle |
| 2. Auto-stagger | computeStaggeredCron() offsets new schedules within 5 minutes of existing active schedules | Prevents future collisions by design |
| 3. Turn budget | Budget header prepended to scheduled task descriptions + prompt analyzer for anti-patterns | Prevents token/cost overruns in scheduled tasks |
| 4. Firing metrics | EMA tracking of turns per firing, auto-pause after 3 consecutive failures | Self-healing schedule management |
The Feedback Loop
This fix was merged to the main branch while the wealth manager remained on its feature branch. The improvement benefits every ainative-business user — anyone running multiple schedules in any project. The platform got better because a domain application stressed it in a way that automated testing had not.
This is the self-reinforcing feedback loop that makes platform-building different from product-building:
Domain application → stresses platform → reveals edge case
    → fix improves platform → platform enables better domain applications
        → better domain applications attract more builders
            → more builders reveal more edge cases → ...
Geoffrey Huntley’s observation applies: the strongest signal a system works is internal dependency. When the platform’s creator depends on the platform for domain-specific work, the quality feedback loop tightens to zero latency.
6. Quantitative Analysis: Build Efficiency Metrics
Raw Metrics
| Metric | Value |
|---|---|
| Total new lines of code | 7,435 |
| Total files modified/created | 44 |
| Build duration | 1 day |
| Commits | 11 |
| New TypeScript interfaces | 18 |
| New functions/methods | 30+ |
| New UI pages | 10 |
| New UI components | 12 |
| External API integrations | 3 (Polymarket Gamma, CLOB, Data) |
| Agent profiles created | 1 (wealth-manager) |
| Workflow definitions created | 3 (rebalance, scenario, divergence) |
| Schedule definitions created | 2 (price monitor, news sentinel) |
| Platform bugs found and fixed | 1 (schedule collision) |
| Tests added (platform fix) | 19 |
Infrastructure Leverage Analysis
To estimate the infrastructure leverage provided by ainative-business, we enumerate the systems that the wealth manager uses but did not build:
| Infrastructure Component | Approximate Equivalent Build Cost | Provided By |
|---|---|---|
| SQLite database with WAL mode | 2,000–5,000 lines | ainative-business core |
| Schema + migration system | 3,000–5,000 lines | Drizzle ORM + ainative-business schema |
| Workflow execution engine | 5,000–8,000 lines | ainative-business workflow engine |
| Schedule/cron system | 2,000–4,000 lines | ainative-business scheduler |
| Agent runtime (LLM integration) | 8,000–15,000 lines | ainative-business agent runtime |
| Governance/approval layer | 3,000–5,000 lines | ainative-business permissions |
| Cost metering system | 1,000–2,000 lines | ainative-business ledger |
| UI framework + components | 5,000–10,000 lines | Next.js + shadcn/ui |
| Authentication + settings | 2,000–3,000 lines | ainative-business settings |
| Total infrastructure | 31,000–57,000 lines | Already existed |
Infrastructure leverage ratio: The builder wrote 7,435 lines of domain code on top of an estimated 31,000–57,000 lines of infrastructure. This represents a 4.2×–7.7× leverage factor — the builder produced a system that would have required 38,000–64,000 total lines by writing only 12–19% of the code.
Comparison: Traditional Build Estimate
For context, we estimate the time a solo full-stack developer would require to build equivalent functionality from scratch:
| Component | Traditional Estimate |
|---|---|
| Database setup + schema | 2–3 days |
| API layer (CRUD + computed) | 3–5 days |
| Scheduler infrastructure | 2–3 days |
| Workflow engine | 5–8 days |
| Agent/LLM integration | 3–5 days |
| UI (10 pages, 12 components) | 5–8 days |
| Prediction market API integration | 2–3 days |
| Testing + debugging | 3–5 days |
| Total | 25–40 working days |
The wealth manager was built in 1 day on ainative-business versus an estimated 25–40 days from scratch — a 25×–40× time compression ratio. This ratio will vary by domain, developer skill, and application complexity, but the order of magnitude is significant.
7. Implications for the Agentic Economy
The Platform Layer is the Moat
The wealth manager case study suggests that in the AI-native era, competitive advantage does not come from AI models (everyone has access to the same foundation models) or from domain knowledge alone (knowledge without infrastructure is just expertise). It comes from the combination: domain knowledge encoded in a composable platform.
The builder’s wealth management knowledge — how to compute drift, how to interpret divergence signals, how to size trades based on conviction — was the irreducible domain expertise. But that expertise was only deployable because the platform handled everything else: data persistence, scheduling, orchestration, governance, and agent management.
This mirrors the pattern described by Dorsey and Botha in their Sequoia essay: “The winning companies will not have the most engineers or compute. They will have the best world model.” The world model — the structured understanding of a domain encoded in queryable data — is what makes the platform valuable. The wealth manager’s prediction markets table, with its linked symbols, probability tracking, and divergence detection, is a financial world model. It is queryable by agents, updated by schedules, and synthesized by workflows. That is the moat.
The “Make It Your Own” Pattern
The most significant implication may be for ainative-business’s market positioning. The wealth manager demonstrates that ainative-business is not limited to project management and task execution. It is a platform that individual knowledge workers can shape around their own domain:
| Domain | Equivalent Build Pattern |
|---|---|
| Wealth Management | Positions → prediction markets → divergence detection → conviction synthesis |
| Litigation Management | Cases → court calendar → precedent tracking → strategy synthesis |
| Real Estate Investing | Properties → market comparables → lease tracking → acquisition scoring |
| Supply Chain | Inventory → supplier monitoring → tariff probability → procurement priority |
| Clinical Research | Trials → regulatory tracking → endpoint monitoring → safety synthesis |
| Content Operations | Calendar → audience analytics → competitor monitoring → editorial planning |
In each case, the pattern is identical: domain entities stored in ainative-business tables, monitored by ainative-business schedules, processed by ainative-business workflows, analyzed by ainative-business agents, governed by ainative-business approval gates. The domain logic — the TypeScript functions that encode expertise — is the builder’s contribution. Everything else is inherited.
The Self-Reinforcing Ecosystem
If multiple builders follow this pattern — each shaping ainative-business around their own domain — the ecosystem effects are multiplicative:
-
Platform improvements compound. Each domain application discovers edge cases. Each fix benefits all users. The schedule collision prevention fix discovered during the wealth manager build improved scheduling for every
ainative-businessproject. -
Profiles become reusable. The wealth-manager agent profile could be published to a profile marketplace, allowing other builders to start with financial analysis capabilities without building them from scratch.
-
Workflow blueprints become transferable. The rebalance analyzer workflow — read positions, compute drift, check prediction markets, apply urgency model, generate recommendations — is a template that any portfolio-oriented application could instantiate with different parameters.
-
Domain data enriches the platform. If prediction market integration proves valuable for wealth management, the same integration pattern could be offered as a built-in capability for any project that benefits from forward-looking probability data.
This is the marketplace flywheel described in ainative-business’s companion research paper (“The 10x Vision”), but grounded in a specific example rather than a projection.
8. Limitations and Future Work
Single Case Study
This paper presents a single case study by the platform’s creator. The builder had intimate knowledge of ainative-business’s architecture, APIs, and conventions. A third-party builder would face a learning curve that our metrics do not capture. Future research should document builds by external developers across multiple domains to establish reproducibility.
Build Quality Assessment
We report lines of code and feature count but do not assess code quality, test coverage (the domain code has no dedicated tests — only the platform fix includes tests), or user experience. A production deployment would require additional validation.
Domain Specificity
The wealth management domain is well-suited to ainative-business’s primitives: structured data, time-series monitoring, workflow-driven analysis, and human-in-the-loop decisions. Domains with different characteristics — real-time collaboration, media processing, physical-world interaction — may not benefit equally from this architecture.
Future Work
- External builder studies. Document build experiences from developers who are not the platform creator, measuring learning curve, build time, and completion rate.
- Production deployment tracking. Deploy the wealth manager with live market data and measure schedule reliability, alert accuracy, and recommendation quality over time.
- Cross-domain replication. Replicate the build pattern in 3–5 additional domains (litigation, real estate, supply chain) to validate the generalizability claim.
- Community contribution analysis. Track whether domain-specific profiles, workflows, and integrations are shared and reused across the builder community.
Sources & References
- Grand View Research — Autonomous AI Agents Market Report (2025–2034)
- Carta — Startup Formation Trends: Solo Founder Analysis (2019–2025)
- US Census Bureau — Nonemployer Statistics (Solopreneur Economic Data)
- Gartner — Agentic AI Market Analysis and Failure Rate Projections (2025)
- RAND Corporation — AI Agent Production Failure Rates Study
- Dario Amodei — Interview statements on one-person billion-dollar companies (2025–2026)
- Sam Altman — Statements on AI-enabled solo founders
- Jack Dorsey & Roelof Botha — “From Hierarchy to Intelligence,” Sequoia (March 2026)
- Cobus Greyling — “Eat Your Own AI: The Strongest Signal” (2026)
- Andrej Karpathy — autoresearch: program.md specification pattern
- Geoffrey Huntley — Ralph Wiggum technique: bash loop AI development
- Leopold Aschenbrenner — “Situational Awareness” (2024)
- Polymarket — Gamma API, CLOB API, Data API documentation
ainative-business— AI Native Business: Building Autonomous Business Systems with AI Agents (Book, 2026)ainative-business— AI Transformation Research: Building and Governing AI-Native Businesses (March 2026)- Rothschild et al. — “The Agentic Economy” (ACM, 2025)
© 2026 Manav Sehgal. Apache 2.0. This research paper was written using the same platform it describes. The case-study data is derived from git version control — every metric is traceable to a specific commit in the build history.